


AUD/JPY, Aussie, Australian Dollar Talking Points
- The Australian Dollar has been very strong since setting lows in March of last year.
- In AUD/JPY, the pair has built into a longer-term inverse head and shoulders pattern.
- For the past month, AUD/JPY bulls were stymied by resistance around the two-year-high; but more recently that seems to be giving way, keeping the door open to bullish breakout potential.
- The analysis contained in article relies on price action and chart formations. To learn more about price action or chart patterns, check out our DailyFX Education section.
AUD/JPY has now gained more than 33% from its March 2020 low. This is an impressive sum regardless of the market that’s being looked at, but when taken with the fact that this has been in the midst of a global pandemic in which a number of major economies have experienced pressure, this move is all the more interesting. Back in March of last year when that low was being set, the psychological level at 60.00 turned out to be very helpful, as this level helped to carve out the low. Now, not even a year later, and the 80.00 handle has come into play as bulls continue to press forward in the pair.
But, along the way a formation of interest has built that may be pointing to the possibility of even more strength on the horizon, and that’s an inverse head and shoulders pattern, shown on the below weekly chart of AUD/JPY.
To learn more about the inverse head and shoulders pattern, check out DailyFX Education
AUD/JPY Weekly Price Chart
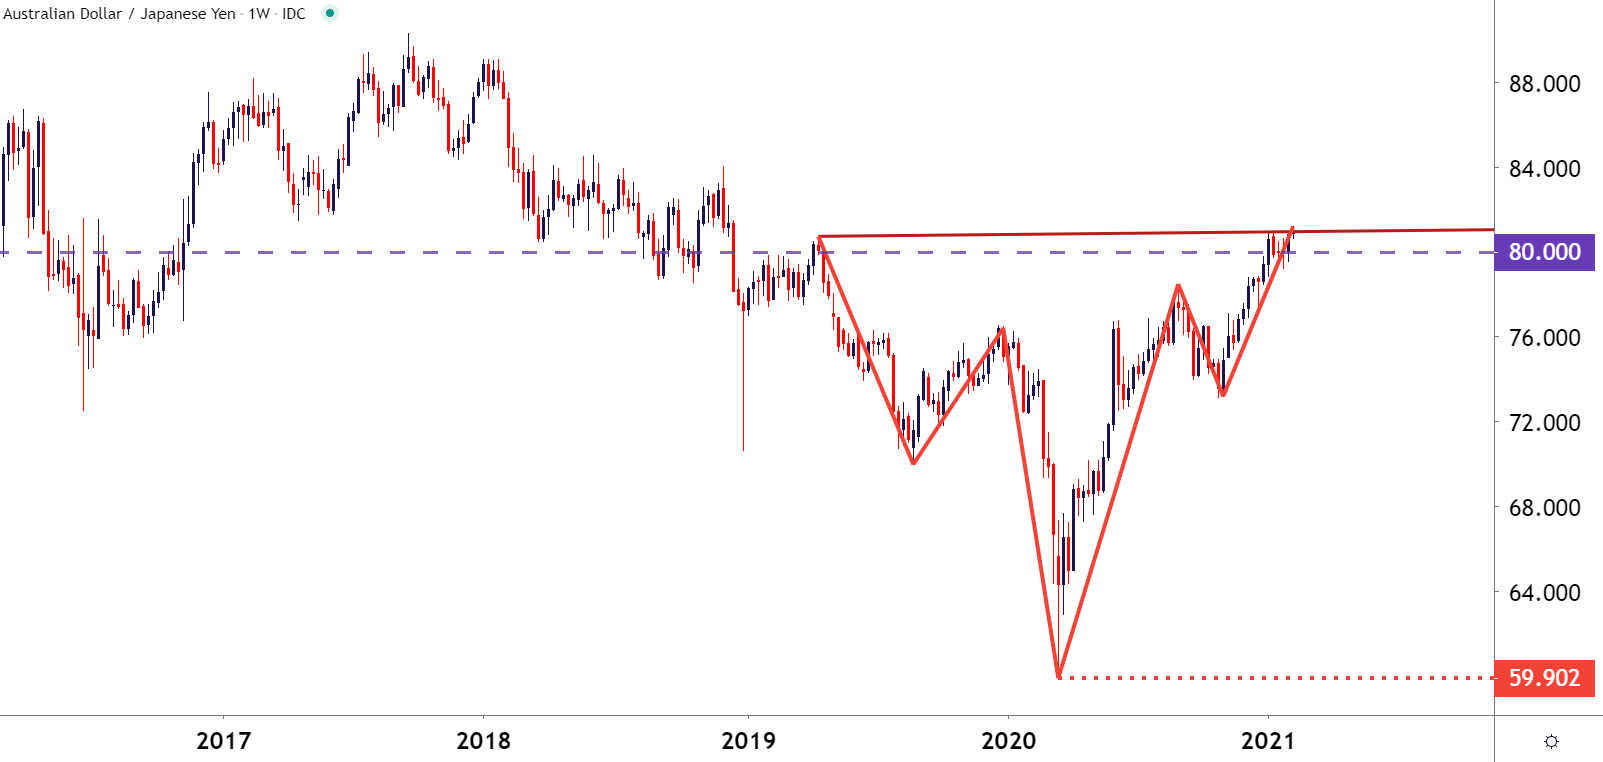
Chart prepared by James Stanley; AUDJPY on Tradingview
On a shorter-term basis, AUD/JPY has been fairly messy since challenging the two-year-high in early January. This plots around 80.72 and, until last week, there’d been a minimum of price action testing above this price. But Friday brought a breakout that, so far has held through the first couple days of this week, keeping the door open for the possibility of more.

AUD/JPY Daily Price Chart
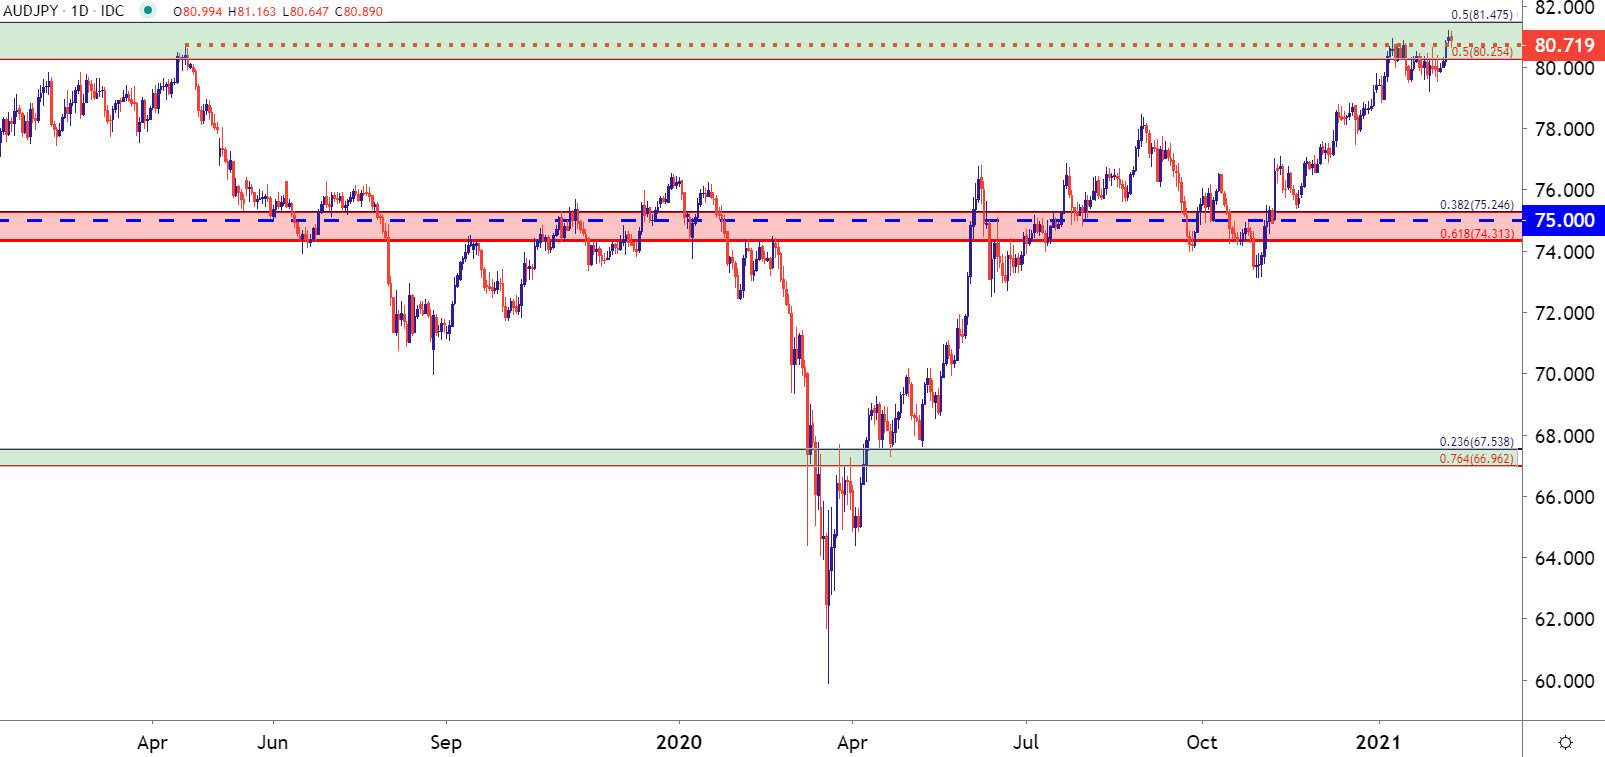
Chart prepared by James Stanley; AUDJPY on Tradingview
Going down to an even shorter-term chart, and we can see where that prior point of resistance is now coming in as short-term support. That 80.72 level that helped to set the high back in April of 2019 is now being re-purposed for support after buyers were finally able to push the pair back above the big figure at 80.00.
This can help to keep the door open to short-term bullish trend strategies which can align with longer-term breakout strategies as looked at on the earlier weekly chart. Just above price action is a Fibonacci level of interest around 81.48, and this could be seen as an ‘r1’ type of resistance. Beyond that, the 82.50 psychological level looms large, and above that is the 84.00 level, which helped to set resistance back in December of 2018.

AUD/JPY Four-Hour Price Chart

Chart prepared by James Stanley; AUDJPY on Tradingview
--- Written by James Stanley, Strategist for DailyFX.com
Contact and follow James on Twitter: @JStanleyFX


