


USD, Euro, GBP, CAD, JPY Talking Points:
- USD price action is very messy at the moment.
- Prevailing trends elsewhere can allow for strategy around the USD, such as EUR/USD testing resistance as GBP/USD jumps to fresh highs.
- The analysis contained in article relies on price action and chart formations. To learn more about price action or chart patterns, check out our DailyFX Education section.
As we’re now half way through the first quarter of 2021, the trends that have shown in risk markets are noteworthy but, what’s happened so far in the US Dollar has been the opposite. Sure, there was a surprising streak of strength for the USD in the first month of this year. But, so far in February, that bullish theme in the USD has fallen flat as sellers have made a return.
But they haven’t been able to completely take control of the situation yet, and this flies counter to many prognostications for markets in 2021, in which the wide expectation appeared to be for continued strength in risk markets like stock and cryptocurrencies, helped along by a continued fall in the US Dollar as the Fed remained very loose and dovish.
Well, most of that’s happened, with the exception of USD-weakness. The Fed does remain loose and passive and they’ve seemingly shrugged off every threat that’s been brought up. Inflation appears to remain steady in the data, but the data has long been argued as an inadequate judge of actual inflationary pressure. So, rates are rising for fear that inflation will pick up, and this is helping to keep the US Dollar supported as Gold prices tank. But stocks are still rising, too, and cryptocurrencies continue to shred up to fresh highs.
To learn more about the Fed and How Central Banks Impact Markets, check out DailyFX Education
The US Dollar is very messy on a short-term basis, as there’s been little discernible short-term trend to work with over the past few days. The bigger item appears to be one of levels and direction: If the USD can finally take-out that 90.00 level on DXY, the door could quickly open to short-side scenarios, and pairs like GBP/USD or AUD/USD could be well-situated to take advantage of that. But if 90.00 can hold, and USD bulls can push through the 90.74 swing-high, USD-strength strategies can be favored and this could be followed in markets such as EUR/USD or USD/CAD.
US Dollar Daily Chart: Waiting on a Break to Resolve the Slop
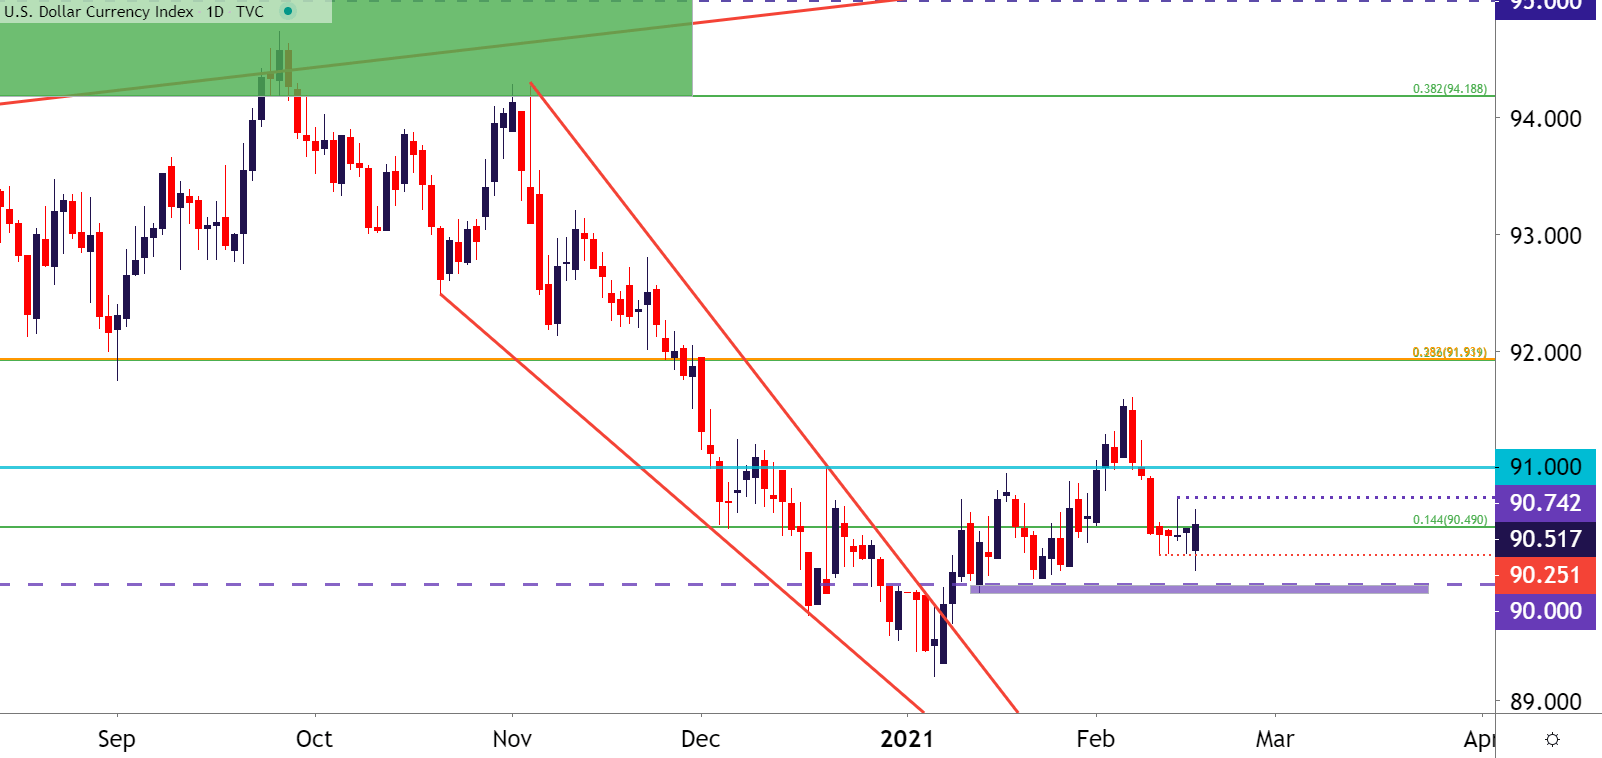
Chart prepared by James Stanley; USD, DXY on Tradingview
EUR/USD Hangs at Resistance Zone
For long-USD scenarios, the setup in EUR/USD may retain some interest. The pair is now working on its fifth consecutive day of resistance at the 1.2134-1.2167 resistance area; the same that held the highs in early-December before becoming support a couple of weeks later. This zone induced a bearish move earlier this month, and sellers tested below the 1.2000 level temporarily before a bullish engulfing candlestick printed. That bullish engulf continued-higher through last week, until this resistance zone came back into play; and a continued hold here keeps the door open for short-term pullback scenarios.
To learn more about the bullish engulfing candlestick, check out DailyFX Education
EUR/USD Daily Price Chart: Bullish Engulf Leads Back to Resistance
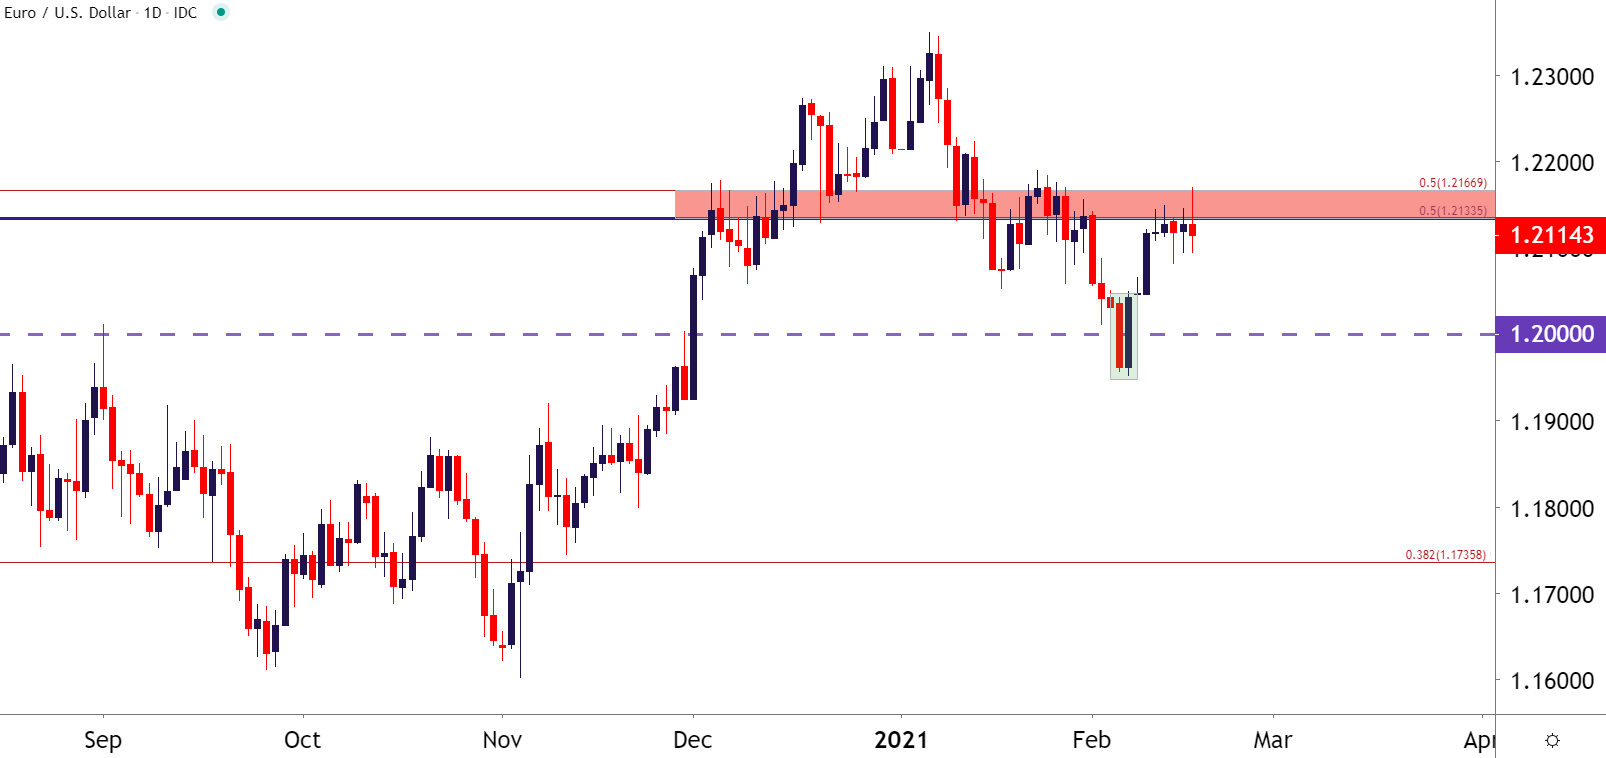
Chart prepared by James Stanley; EUR/USD on Tradingview
GBP/USD: Cable Crush
On the short-side of the US Dollar, GBP/USD has been making some significant moves. The pair had previously built into a rising wedge pattern, which will often be approached with the aim of bearish reversals. But that formation was negated last week when GBP/USD instead embarked on an aggressively bullish breakout, which has so far continued through the new week.
I had written up an article on the British Pound earlier today and included a look at the major pair of GBP/USD. That analysis largely remains the same, with focus on short-term strength as a mechanism for working with USD-weakness. The nearest support level has already garnered an inflection, and this can keep the door open for support at this level around 1.3866. Below that is a zone of interest from 1.3759-1.3773, and if that can’t hold, then the prior area of resistance may come back into play and this could be very interesting for long-term bullish scenarios in the pair.

GBP/USD Four-Hour Price Chart
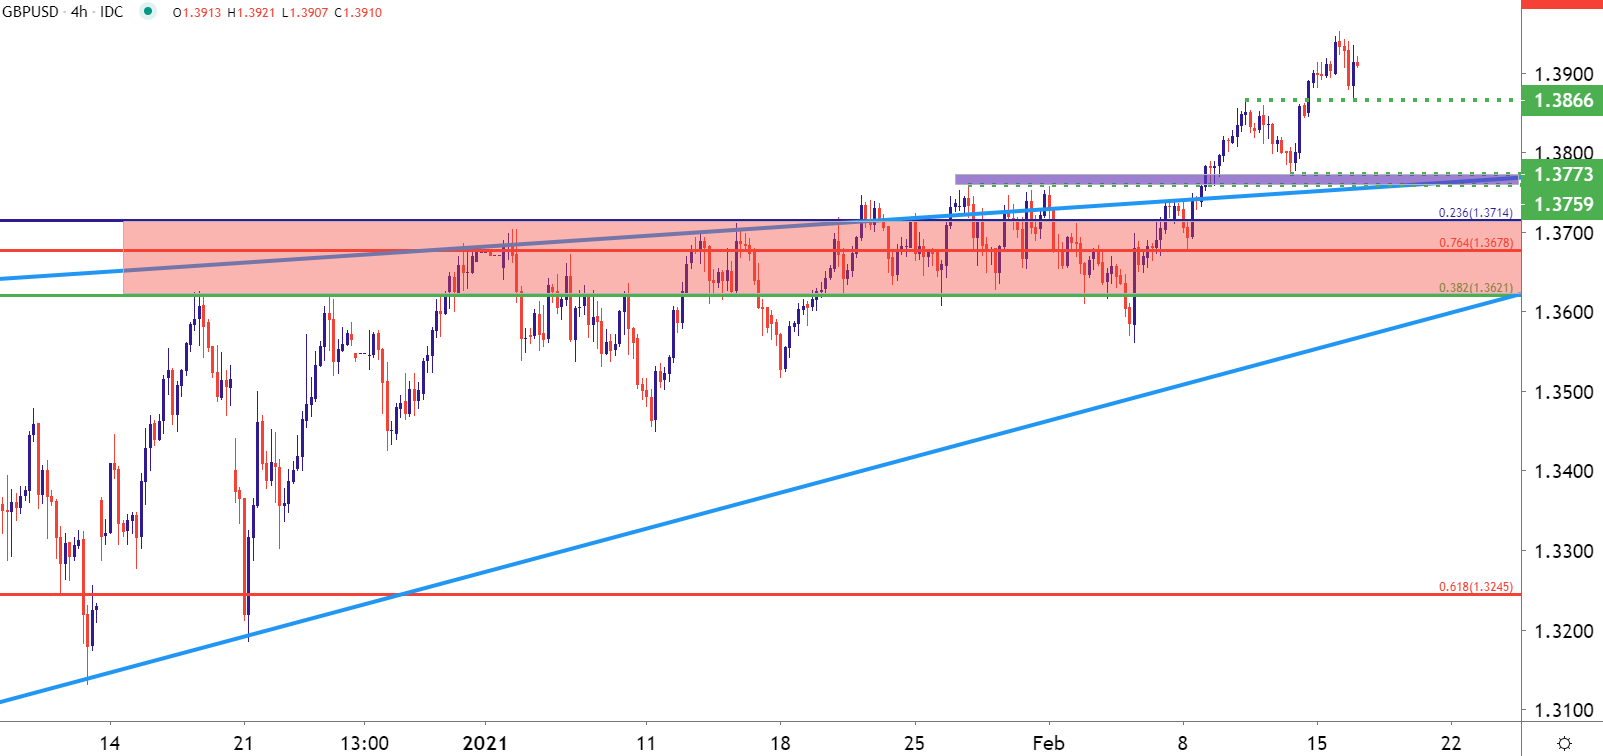
Chart prepared by James Stanley; GBP/USD on Tradingview
Yen Gives In – Yen Weakness Runs Rampant
USD/JPY can be a tricky pair but one of the big takeaway from what’s happened in that market of recent is just how much weaker the Japanese Yen has been than the US Dollar. And given what’s showing in rates right now, along with the wide expectations for Central Bank accommodation to continue, there may be more room to run on Yen-weakness in the near-term.
This was partially behind the AUD/JPY breakout that was looked at in last week’s Analyst Pick, following an inverse head and shoulders formation that was starting to give way. That breakout has since taken hold, similar to both EUR/JPY and GBP/JPY.
To learn more about the inverse head and shoulders pattern, join us in DailyFX Education
This can keep JPY as an interesting candidate of weakness, which can then be paired up with a strong currency such as GBP or AUD in looking for continued strength. I had similarly looked into GBP/JPY a little earlier today, and this is a market that could remain of interest for continued breakout scenarios.
GBP/JPY Four-Hour Price Chart

Chart prepared by James Stanley; GBP/JPY on Tradingview
USD/CAD Re-Tests Huge Support
USD/CAD has had a challenging year so far in 2021. The pair came into the year clinging to a downtrend that had lasted for most of last year. But, that trend hit a support level at 1.2621 a few weeks into January and the sell-off began to stall. But – that support inflection showed at a huge spot on the chart, and then formed a morning star formation, after which a bullish reversal began to take hold.
To learn more about the morning star formation, check out DailyFX Education
That morning star led to some continued strength: USD/CAD broke out of a short-term falling wedge, but simply found resistance a couple of days later at a longer-term trendline. That trendline faced days of resistance before bulls finally relented, allowing for prices to sink right back into Fibonacci support.
This presents a compelling argument for bullish scenarios at the moment, particularly if this support can hold. The longer-term falling wedge does offer a bit of bullish breakout potential when/if the upper trendline can be tested again. But, for now, all that we really have is a support inflection.
USD/CAD Daily Price Chart
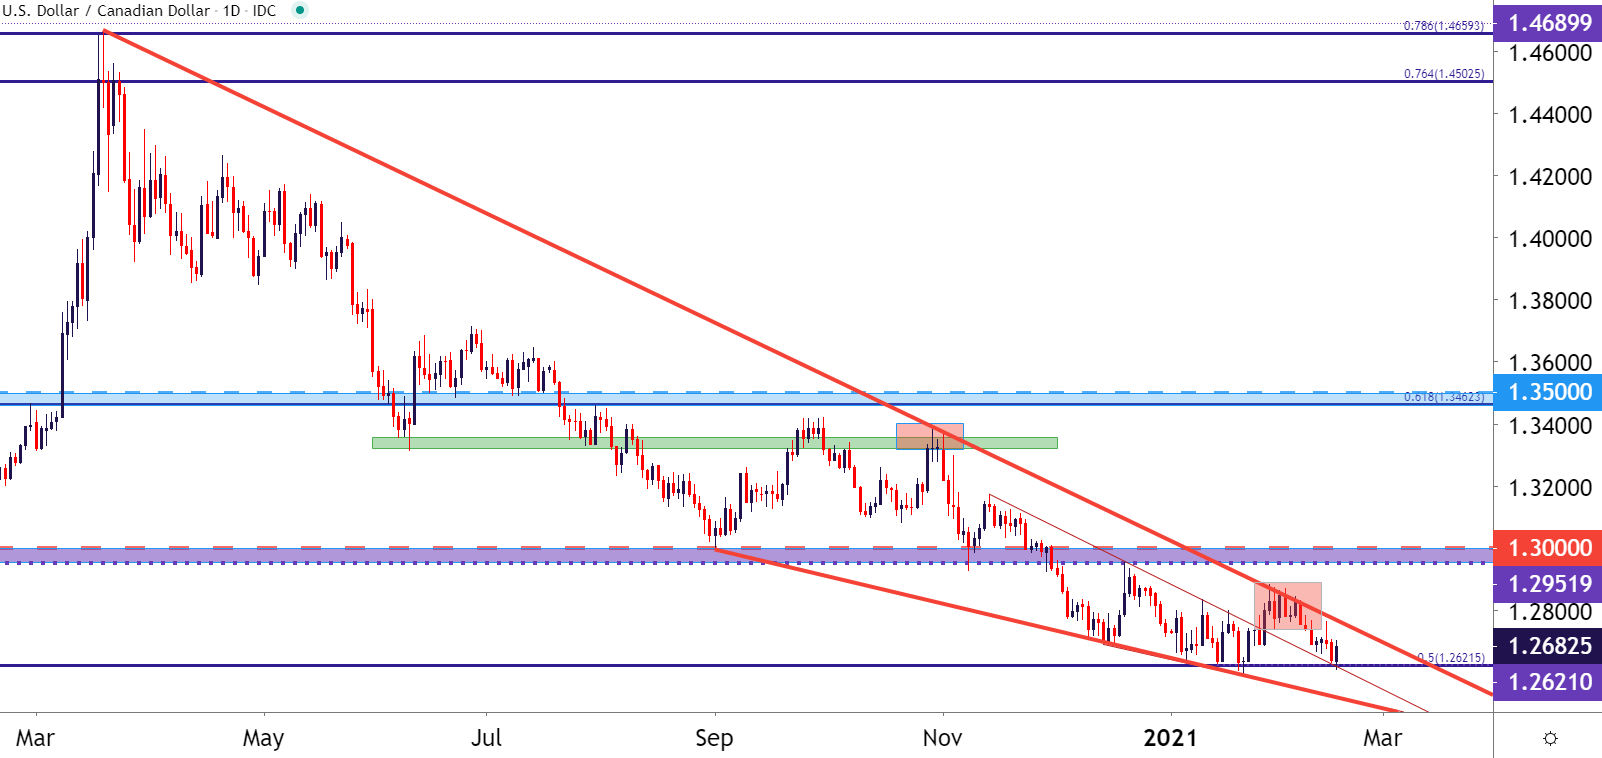
Chart prepared by James Stanley; USDCAD on Tradingview
--- Written by James Stanley, Strategist for DailyFX.com
Contact and follow James on Twitter: @JStanleyFX


