


USD, EUR/USD, GBP/USD, USD/CAD, AUD/USD Price Analysis
- In this archived webinar I looked at a series of setups, focusing in on USD-pairs.
- While ‘manic’ moves have continued to show in a number of markets like TSLA, AMZN and, more recently, the SHCOMP – many major FX pairs remain in range, at least for now.
US Dollar Sets Up Camp on the Range
I had looked at the US Dollar in the Q3 technical forecasts, and it was somewhat surprising that, despite all of the fireworks from the first-half of the year, the USD actually spent the bulk of Q2 in a range-bound state. To be sure, this did come on the heels of a very volatile Q1, especially the month of March as the USD initially tanked down to fresh yearly lows, followed soon after by a 10-day rally that brought an 8.8% gain into the currency. That bullish push amounted to fresh three-year-highs, with bulls scaring away from the 103.00 level on DXY – the same zone of resistance that capped the USD advance in early-2017.

Most of April and the bulk of March – USD remained in range. A quick spurt of trend showed in late-May and drove through early-June, but after running into the 95.86-96.05 support zone, bears pulled back and price action followed, allowing for a range to build into the end of Q2 that remains in-effect today.
The bullish argument around USD would likely be looking for the next leg of range continuation; while the bearish point-of-view, such as what I had shared in the Q3 technical forecast, would likely be looking for a downside break from the range with a move down towards deeper supports around 95.86-96.06 followed by the 95.00 level.
US Dollar Four-Hour Price Chart
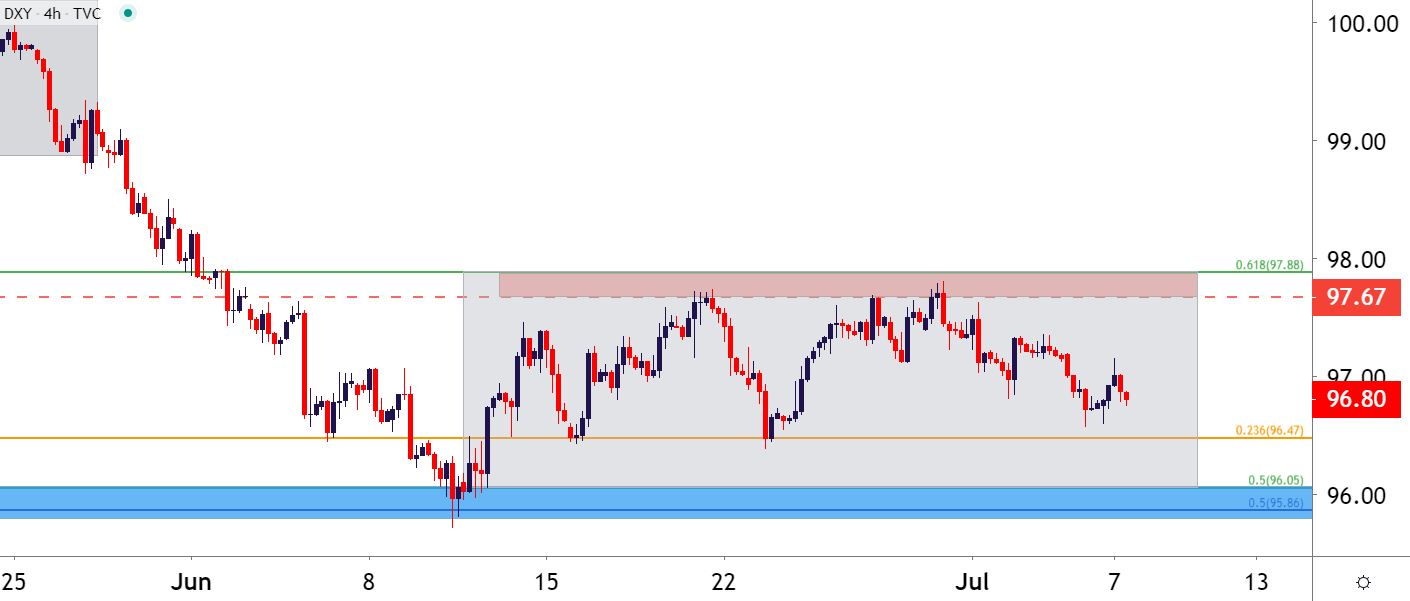
Chart prepared by James Stanley; USD, DXY on Tradingview
EUR/USD Tests Support at Prior Resistance
From a shorter-term vantage point of the four-hour chart, topside potential remains as price action may be in the process of setting a higher-low. That support potential shows up around a prior trendline projection that had previously helped to set resistance; but as the 1.1187-1.1212 range held the lows, price action pushed above for a fresh near-term high, keeping the door open for topside continuation in near-term strategies.
EUR/USD Four-Hour Price Chart
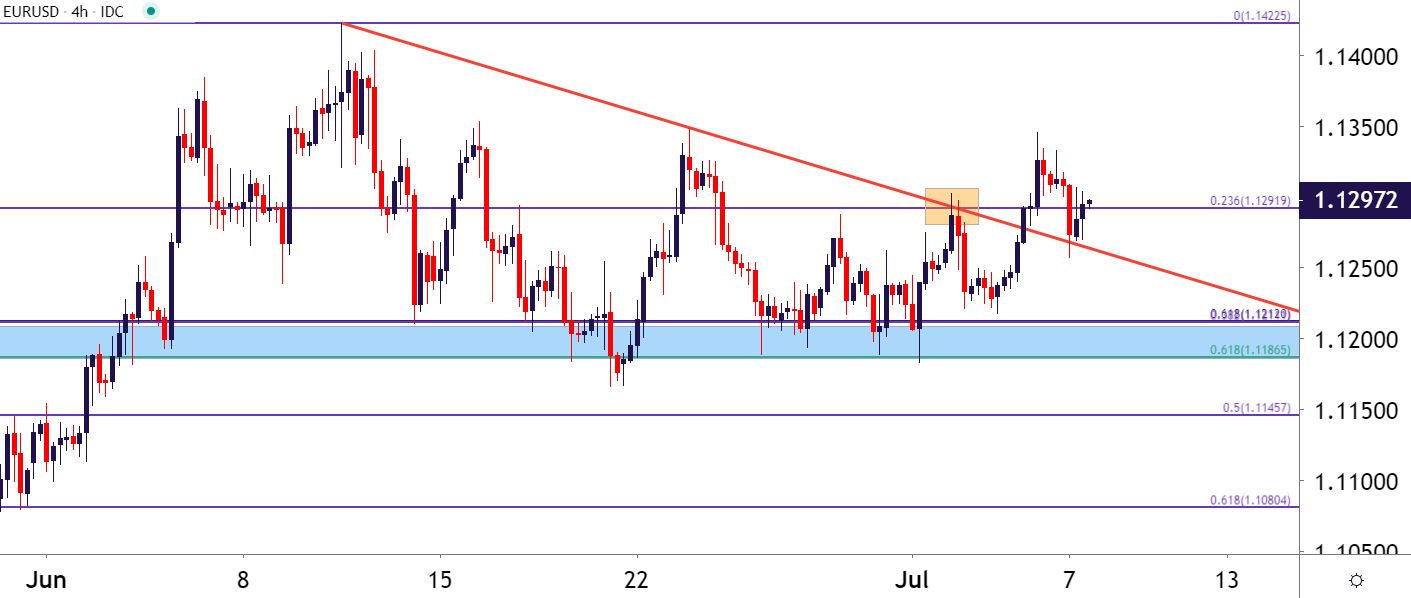
Chart prepared by James Stanley; EURUSD on Tradingview
The longer-term look around EUR/USD may bring on some bearish hints, as there’s been six consecutive weeks of resistance around the 1.1292 level. Given the big batch of resistance sitting just ahead, this may be a case of buyers losing motivation as another large resistance zone looms overhead; but should this area of resistance hold throughout this week, allowing for a sixth consecutive week of resistance around this price, the door may open for short-side swing potential.
| Change in | Longs | Shorts | OI |
| Daily | -1% | -4% | -3% |
| Weekly | 4% | -10% | -5% |
EUR/USD Weekly Price Chart

Chart prepared by James Stanley; EURUSD on Tradingview
GBP/USD Breakout – Possible New Trend
GBP/USD came into July trade after riding a rather consistent trend-lower for the prior few weeks. But, after breaking above the bearish trendline last week, bulls have remained in-charge, posing a series of both higher-highs and higher-lows. This morning saw a breakout above a big zone on the chart, running from 1.2500 up to 1.2518; and at this point, price action has yet to check back for support around prior resistance. That can keep the door open for bullish trend continuation strategies. For the short side, similar to EUR/USD above, sellers may want to wait for some element of confirmation for reversal themes; albeit with a touch-less of optimism given the continued resistance holding the highs in EUR/USD while GBP/USD is in process of setting a new higher-high.
GBP/USD Four-Hour Price Chart

Chart prepared by James Stanley; GBPUSD on Tradingview
USD/CAD: Still in Range, Testing a Tough Spot
I had written about the range in USD/CAD yesterday, and this has many similarities to the backdrop in USD looked at above. After coming into June trade in the midst of a trend, prices soon found support and finished the remainder of Q2 in a range-bound state. Through the first few days of Q3, that range has continued, and yesterday saw prices hold the lows before a re-test of a key support zone, running from 1.3462-1.3500.
| Change in | Longs | Shorts | OI |
| Daily | -2% | 7% | 5% |
| Weekly | -30% | 38% | 13% |
The complication at the moment is a confluent spot of resistance which is somewhat near the middle of that recent range, helping to set near-term resistance. This could provide challenges on either side of the matter until price action cleans up a bit.
USD/CAD Four-Hour Price Chart
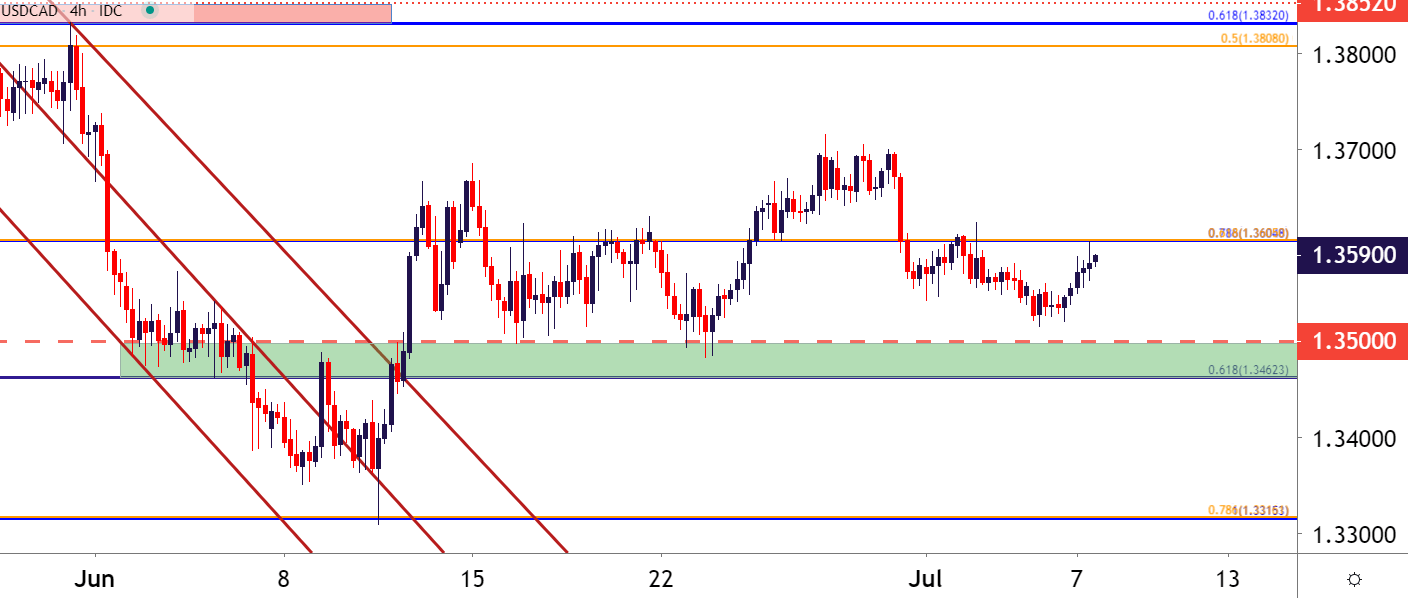
Chart prepared by James Stanley; USDCAD on Tradingview
AUD/USD Pulls Up Shy of the Big Fig
Last week, AUD/USD had built into a symmetrical wedge after failing to break-through the .7000 level. That wedge, combined with the prior bullish trend, made for a bull pennant formation – as discussed by my colleague Warren Venketas in his article, Aussie Price Forecast: Can AUD/USD Break the Bull Pennant? And now with a bit of hindsight, we can answer ‘yes,’ although there hasn’t been much continuation after. Last night saw sellers come in ahead of a .7000 re-test; and while intermediate-term trends have yet to show any signs of abating, proximity to that big level of resistance could complicate topside approaches. Conversely, a hold of resistance around this area, combined with a show of bearish pressure as denoted by lower-lows and lower-highs, similar to what was looked at on the hourly chart, may soon re-open the door for bearish strategies in the pair, looking for price action to claw back a portion of recent gains in the AUD/USD pair.
AUD/USD Two-Hour Price Chart
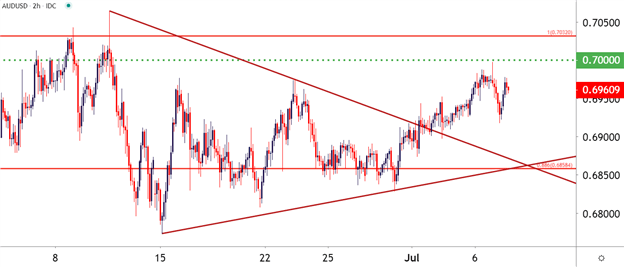
Chart prepared by James Stanley; AUDUSD on Tradingview
--- Written by James Stanley, Strategist for DailyFX.com
Contact and follow James on Twitter: @JStanleyFX


