


AUD price analysis:
- The bullish pennant pattern can build after price action digests a recent trend.
- The bull pennant formation is often approached as a continuation pattern, looking for the original trend to continue after digestion takes the form of a symmetrical wedge.
- Q2 has provided the AUD with gains against the USD, can AUD bulls continue this momentum through Q3?
AUD/USD Exhibiting Bullish Pennant Set Up
The AUD/USD pair has come off a strong Q2 for AUD bulls due to US quantitative easing as well as better than expected Australian economic data. Price action is currently consolidating within a bullish pennant formation with near-term breakout potential. Price has been respective of the trendlines at both support and resistance (yellow) whilst wading through the pennant. The bullish pennant theoretically relates to a continuation pattern which in this case may lead to stronger upside price movement.
AUD/USD 4-hour chart:

Chart prepared by Warren Venketas, IG
The daily chart below highlights the Fibonacci retracement taken from January 2018 high to March 2020 low. The breakout in early June beyond the 50% 6822.8 level has since helped to set support over the past month.
Focusing on a break above or below the pennant formation could be key for traders looking to identify either an extension of medium-term bullish impetus, or a reversal of trend in line with the nine year long bearish trend beginning in 2011.
AUD/USD daily chart:
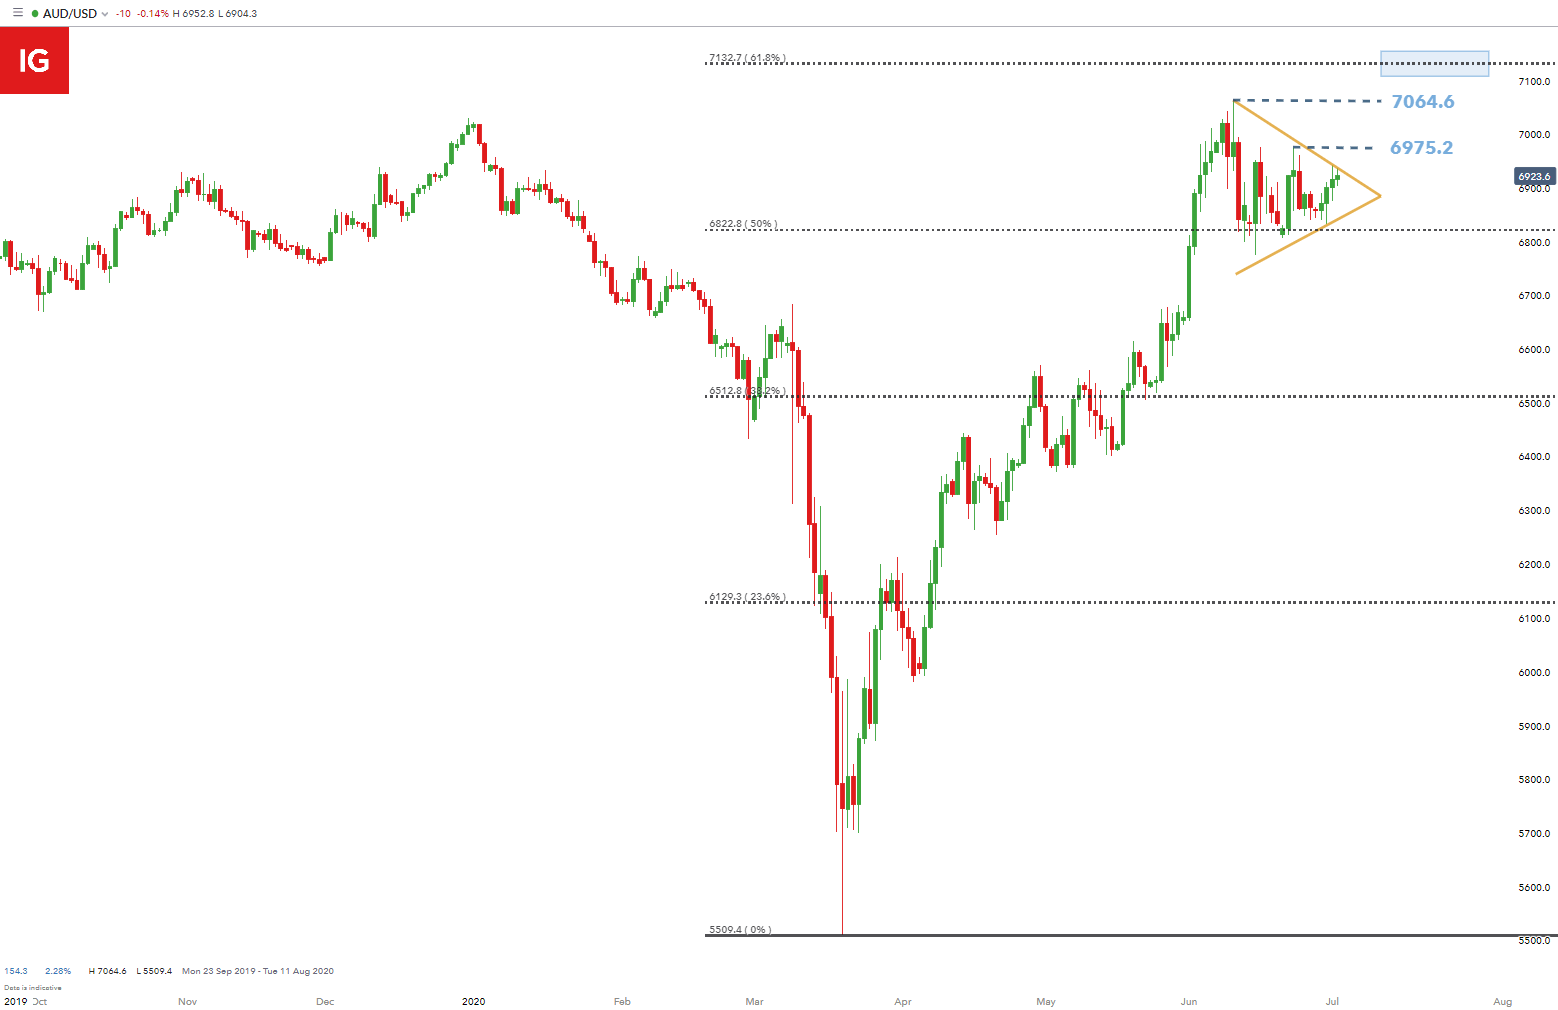
Chart prepared by Warren Venketas, IG
AUD/USD STRATEGY MOVING FORWARD
Bulls will be eying a break above the trendline resistance level for further upside momentum with initial resistance likely coming from the most recent swing highs at 6975.2 and 7064.6 (marked in blue) respectively. If price surges through these recent swing highs, the next level of major resistance (blue rectangle) will come via the 61.8% Fibonacci level – 7132.7.
From the bearish perspective, bears may be on the lookout for a break below the trendline support level with immediate resistance coming through the 50% Fibonacci level – 6822.8. Recent NFP data has strengthened this bearish outlook with stronger than expected data.
It is important to note that breakouts can be false with validation often needed to confirm the pattern. With this in mind, sound risk management technique always be observed.
CAN BULLS PULL AUD/USD TO FRESH 2020 HIGHS IN Q3?
| Change in | Longs | Shorts | OI |
| Daily | 1% | 6% | 2% |
| Weekly | 22% | -16% | 12% |
IGCS shows retail traders are currently considerably short on the pair, with 61% of traders currently holding short positions (as of this writing). We typically take a contrarian view to crowd sentiment, and the fact traders are net-short suggests AUD/USD prices may continue to rise.
--- Written by Warren Venketas for DailyFX.com
Contact and follow Warren on Twitter: @WVenketas
https://www.dailyfx.com/aud-usd


