


Price Action Setups Talking Points:
- The US Dollar has been fairly tame this week, putting in the net of a doji on the weekly candlestick thus far.
- Next week is a holiday in the US with Thanksgiving on Thursday. This could further constrain price action in the near-term.
- DailyFX Forecasts are published on a variety of markets such as Gold, the US Dollar or the Euro and are available from the DailyFX Trading Guides page. If you’re looking to improve your trading approach, check out Traits of Successful Traders. And if you’re looking for an introductory primer to the Forex market, check out our New to FX Guide.
The US Dollar has been fairly tame so far this week with this week’s candlestick currently showing as a doji at this point. There are, however, some major pairs of interest that could remain workable into next week. Of note, next week is a holiday in the United States on Thursday in observance of Thanksgiving and the day after is Black Friday which will likely mean lower levels of liquidity across US markets. This doesn’t eliminate the possibility of volatility though, as that lower-liquidity backdrop can push prices very quickly should motive show, similar to what happened around the Dubai World bankruptcy announcement a in 2010.
US Dollar Daily Price Chart
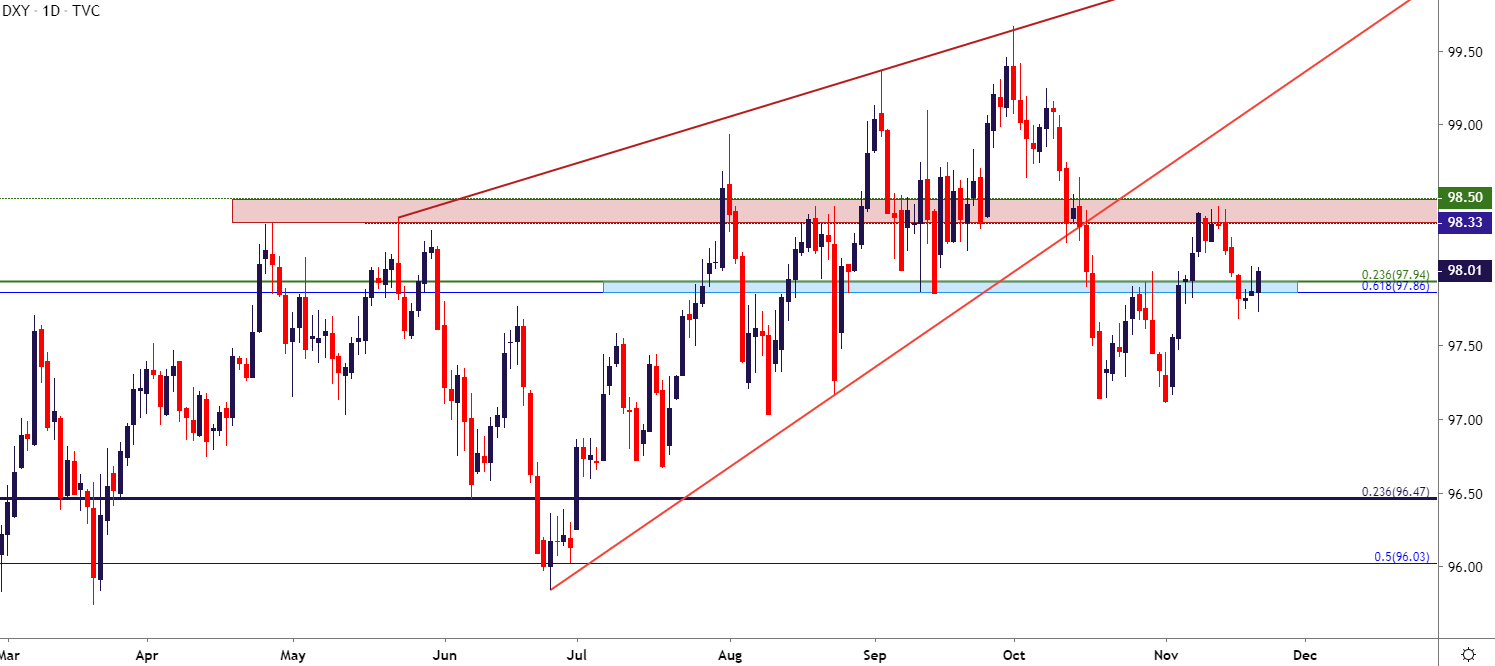
Chart prepared by James Stanley; US Dollar on Tradingview
EUR/USD Bears Re-Appear but Can They Break Through 1.1000?
I had looked at this one on Tuesday as EUR/USD was finding resistance at the 38.2% retracement of the June-October major move. As I had noted there, the short-side theme felt like it needed a bit of capitulation, and I drew a zone of interest from 1.1100 up to 1.1110 to look for that scenario to play out. And it may have earlier this morning without price action reaching all the way up to 1.1100. Current prices are finding support at another Fib level around 1.1060; after which the 1.1032 level becomes of interest. Below that brings back last week’s support around the 1.1000 handle for another showdown at the big figure.
EUR/USD Four-Hour Price Chart
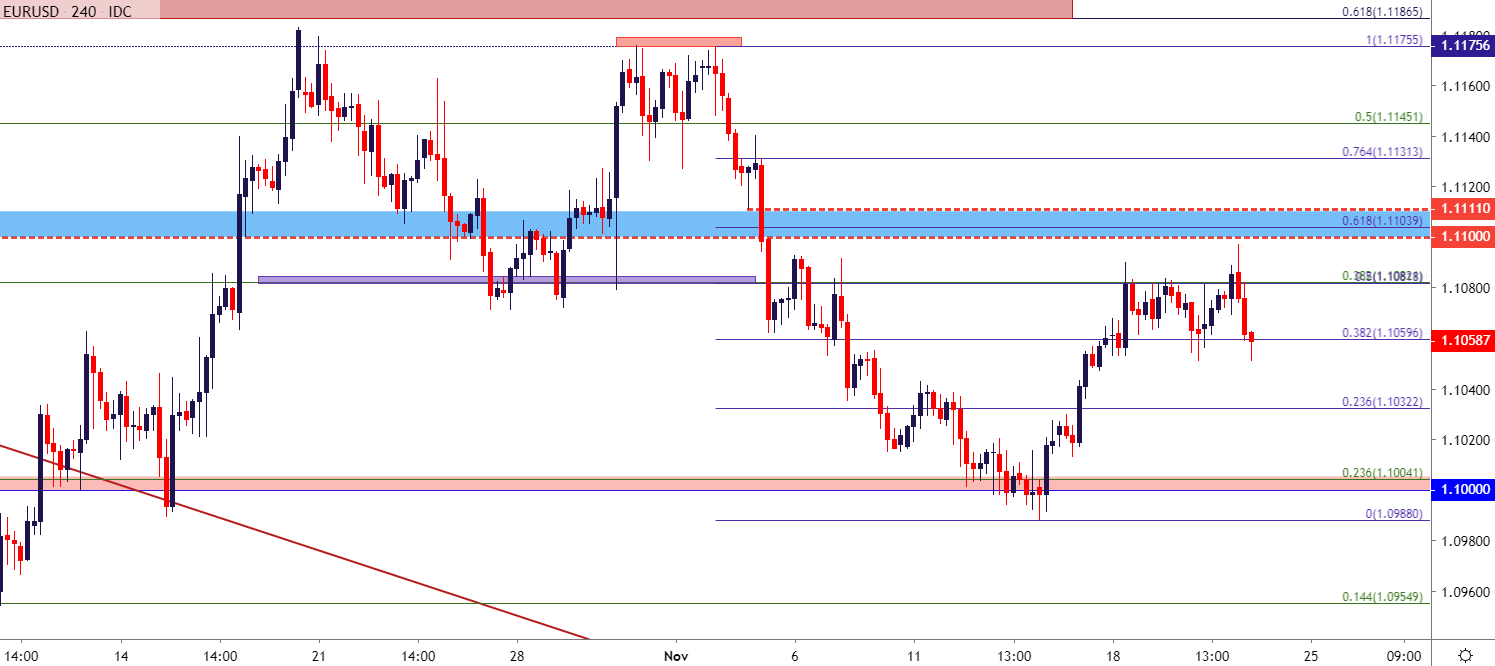
Chart prepared by James Stanley; EURUSD on Tradingview
GBP/USD Pulls Back to Support – But Can Bulls Stage Another Run?
The 1.3000 resistance level continues to loom large in GBP/USD and yet again, buyers seemed uninterested in a re-test of the big figure after this morning saw prices turn around from the 1.2970 level.
In quick order, price action has reverted directly back to prior support around the 1.2900 handle. The big question is whether this zone can hold yet another support inflection, similar to what I had looked at on Tuesday.
GBP/USD Two-Hour Price Chart
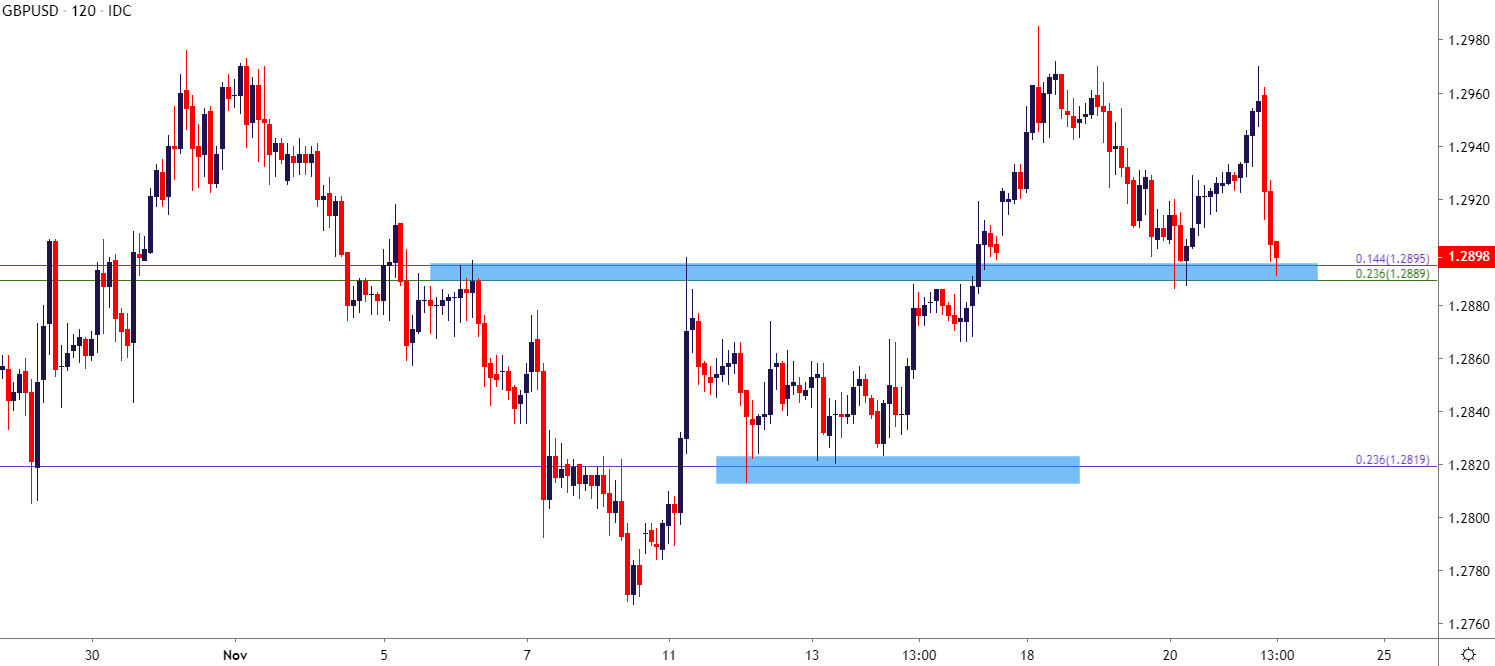
Chart prepared by James Stanley; GBPUSD on Tradingview
USD/CAD Support at Prior Resistance
The past couple of days have brought some interesting CAD drivers into the mix, with Tuesday’s Wilkins comments bringing in weakness and this morning’s Poloz comments that reversed that move.
At this point, USD/CAD is finding support around prior resistance. This can open the door for short-term bullish setups, looking for a push back towards 1.3320 after which the prior November highs around 1.3340 come into play. Bigger picture resistance remains 1.3361-1.3385.
USD/CAD Eight-Hour Price Chart
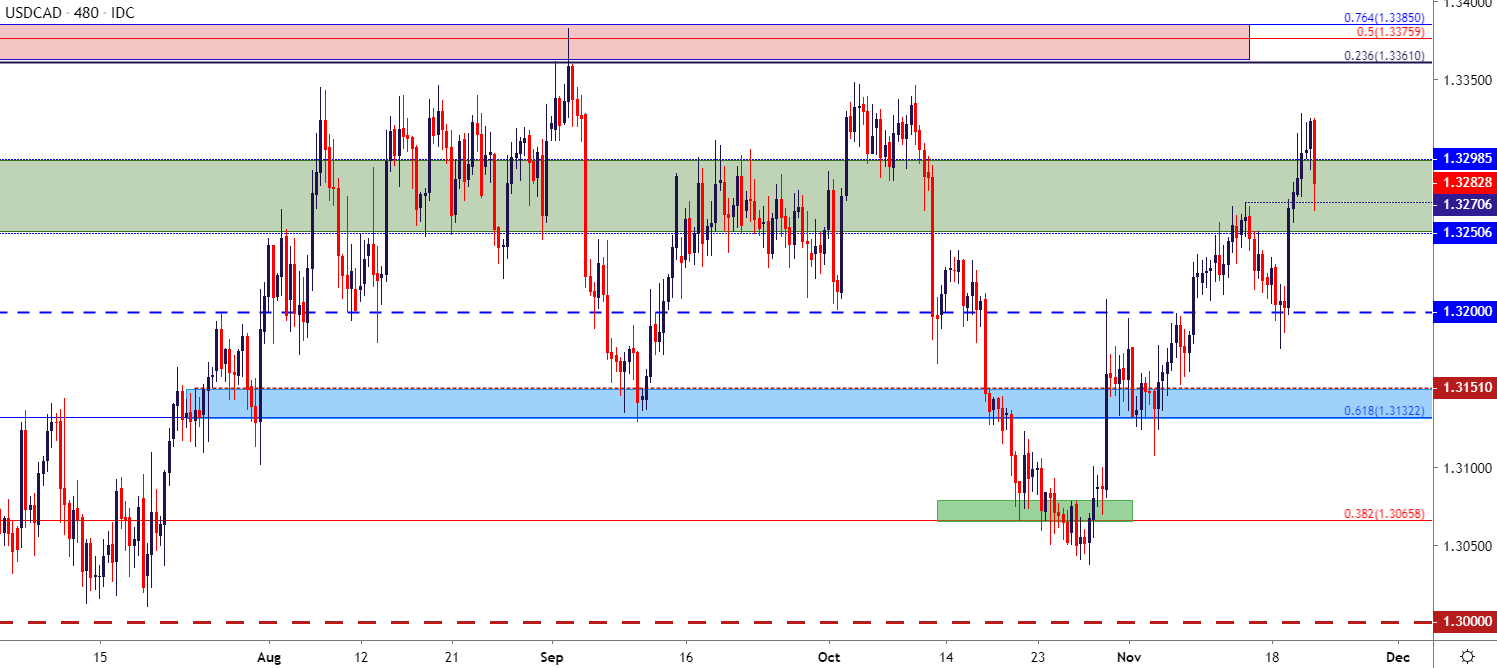
Chart prepared by James Stanley; USDCAD on Tradingview
AUD/USD: Bear Trap Potential So Close to .6700
The longer-term bearish trend remains attractive in AUD/USD and this has come back into light in the month of November after an inflection from a key trendline. The issue at this point is one of proximity, as price action is so close to the .6700 level that’s proven difficult to break.
AUD/USD Daily Price Chart
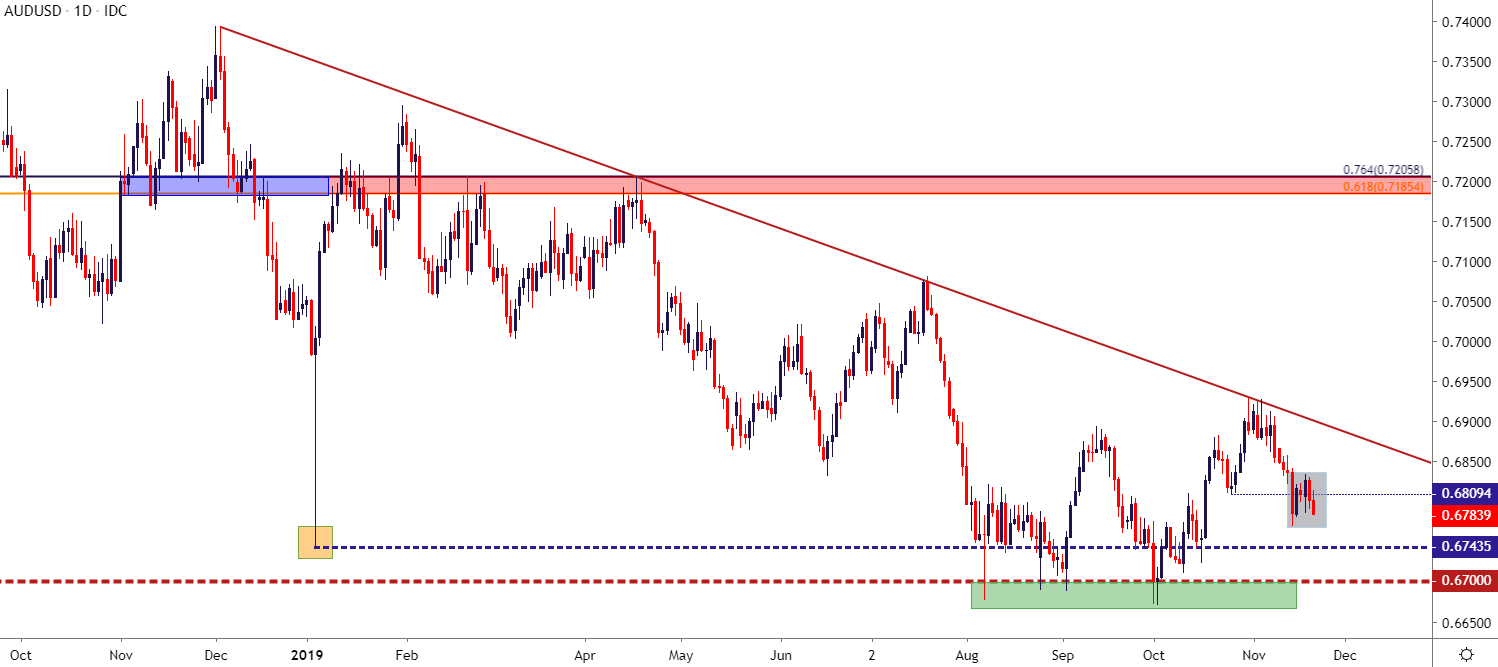
Chart prepared by James Stanley; AUDUSD on Tradingview
Gold May Be Nearing Another Support Test
A big area of support came into play a couple of weeks ago in Gold and this helped prices to push back up to find resistance at a prior area of support. And as looked at yesterday, this kept the door open for bearish intermediate-term plays. Prices have now pushed lower and are threatening a return trip to the 1453-1460 area and, below that, the November swing-low at the 38.2% retracement of the summer breakout.
Gold Price Four-Hour Chart
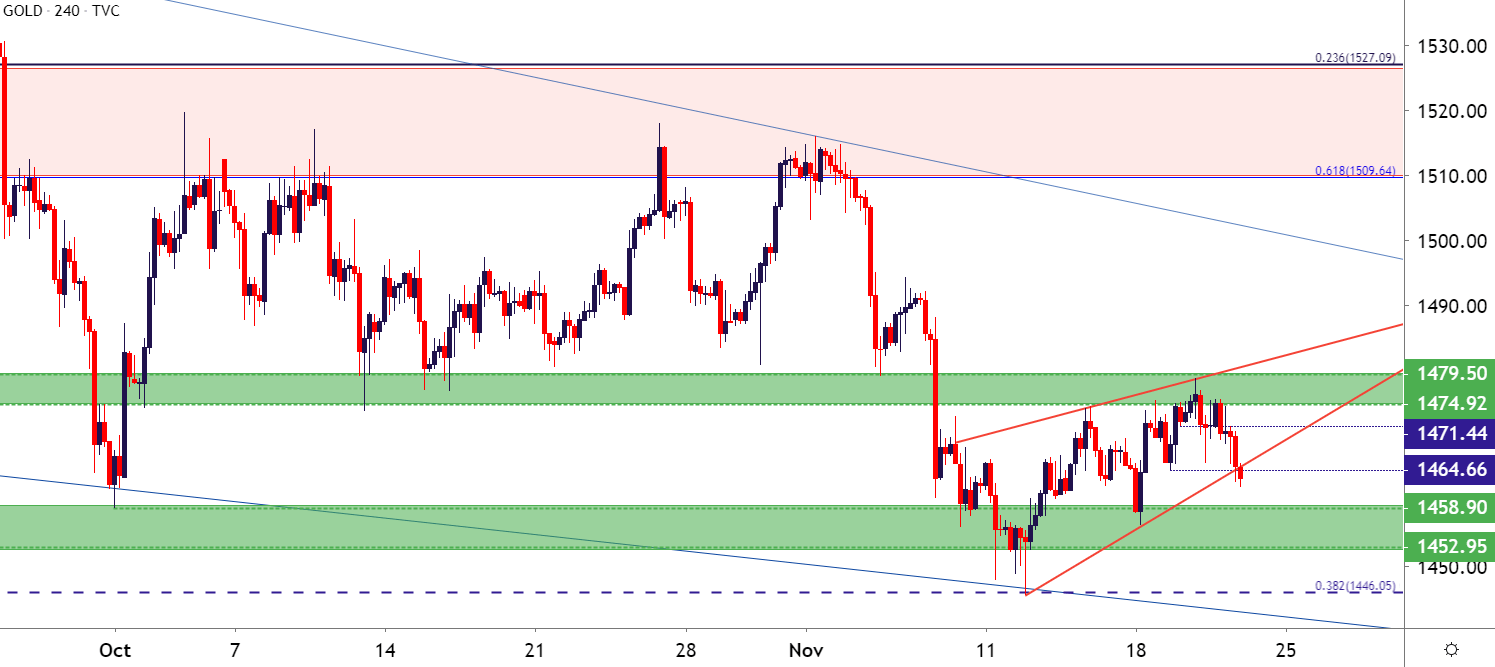
Chart prepared by James Stanley; Gold on Tradingview
To read more:
DailyFX offers an abundance of tools, indicators and resources to help traders. For those looking for trading ideas, our IG Client Sentiment shows the positioning of retail traders with actual live trades and positions. Our trading guides bring our DailyFX Quarterly Forecasts and our Top Trading Opportunities; and our real-time news feed has intra-day interactions from the DailyFX team. And if you’re looking for real-time analysis, our DailyFX Webinars offer numerous sessions each week in which you can see how and why we’re looking at what we’re looking at.
If you’re looking for educational information, our New to FX guide is there to help new(er) traders while our Traits of Successful Traders research is built to help sharpen the skill set by focusing on risk and trade management.
--- Written by James Stanley, Strategist for DailyFX.com
Contact and follow James on Twitter: @JStanleyFX


