


Gold Price Talking Points:
- Gold prices have bounced over the past week after an aggressive sell-off to start the month of November.
- The longer-term bullish trend remains in-tact, however, as that early-November sell-off found support at the 38.2% Fibonacci retracement of the summer breakout. Timing the return of that bullish trend is the current objective.
- DailyFX Forecasts are published on a variety of markets such as Gold, the US Dollar or the Euro and are available from the DailyFX Trading Guides page. If you’re looking to improve your trading approach, check out Traits of Successful Traders. And if you’re looking for an introductory primer to the Forex market, check out our New to FX Guide.
Gold Prices Recovery After Early-November Spill
Gold prices have displayed a tone of recovery over the past week after starting November on a very sour note. As risk rallies were showing across a number of global markets, the fear bid left Gold, at least temporarily, as prices dropped down to fresh three-month-lows, eventually finding support at the 38.2% Fibonacci retracement of the summer breakout.
Gold Daily Price Chart: Three-Month-Lows at 38.2% Fibonacci Retracement
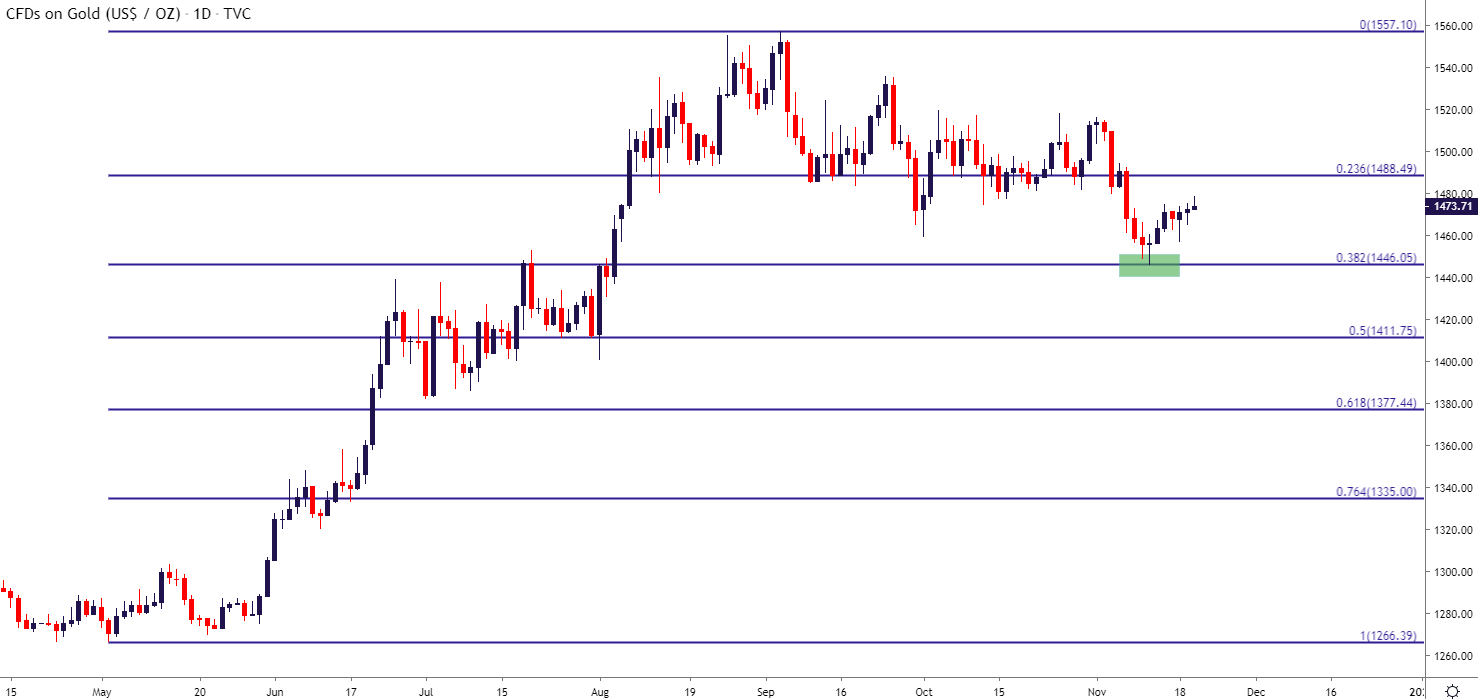
Chart prepared by James Stanley; Gold on Tradingview
Adding some additional context into the matter and a couple of zones discussed in these Gold technical pieces have recently come into play to help guide that move.
Around support has been a zone that runs from the July swing-high of 1453 up to the October swing-low around 1460. Given that there were no daily closes below this zone and merely an interaction followed by a bullish bounce, that support zone remained respected even as sellers were in firm control of price action earlier this month. Also of interest is a prior support zone that ran from around 1475-1480, which is now helping to set resistance after the bounce that started a week ago. That prior support zone held the lows through multiple tests in October so, at this stage, we have a case of resistance feeding-in from prior support.
Gold Eight-Hour Price Chart
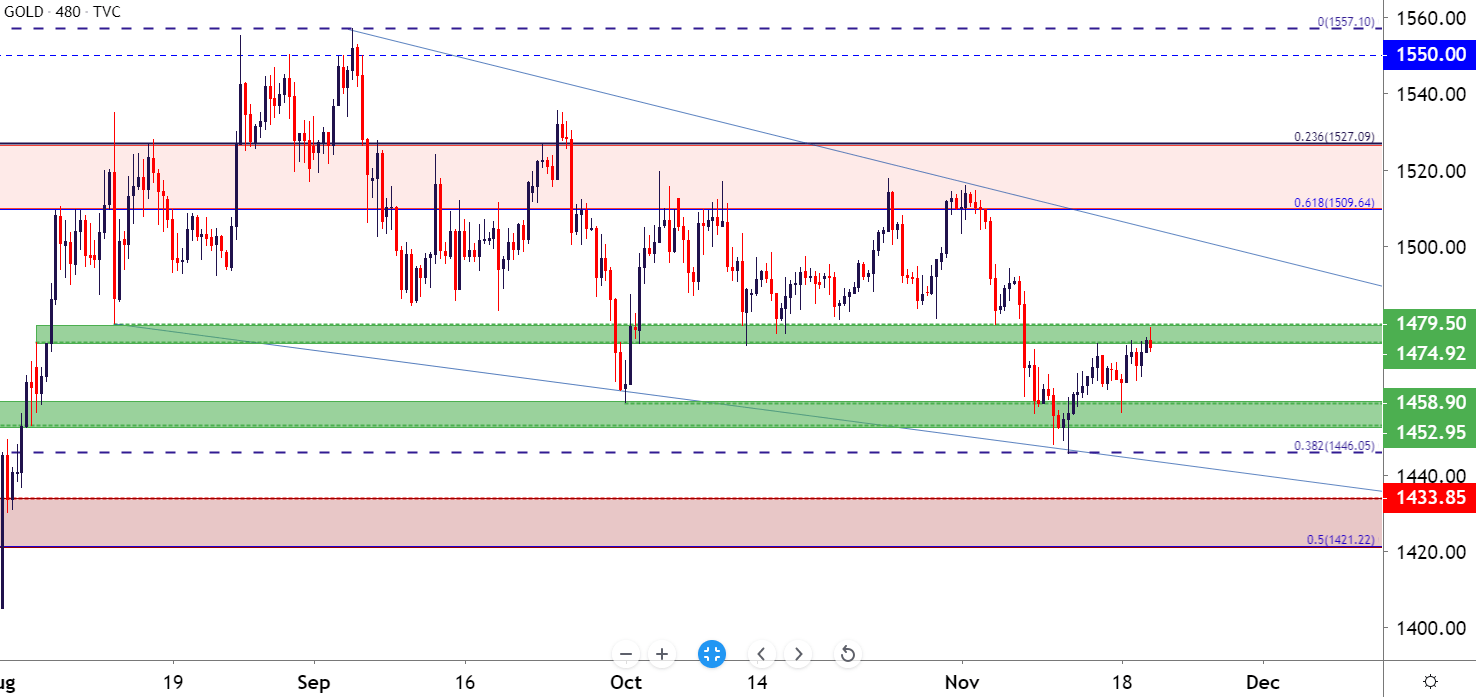
Chart prepared by James Stanley; Gold on Tradingview
Gold Strategy Moving Forward
At this point, there’s a few different trends to work with in Gold prices. The long-term trend remains bullish but timing is of issue, as the pullback in that theme has now run for around three months following the aggressive bullish breakout earlier this summer. However, this is not without precedent as a very similar scenario developed earlier this year when Gold price action built into a falling wedge formation from February and into May. What ultimately prodded bulls back to the bid was the dovish flip at the Fed, noted by comments from FOMC Chair Jerome Powell in early-June.
Gold Daily Price Chart
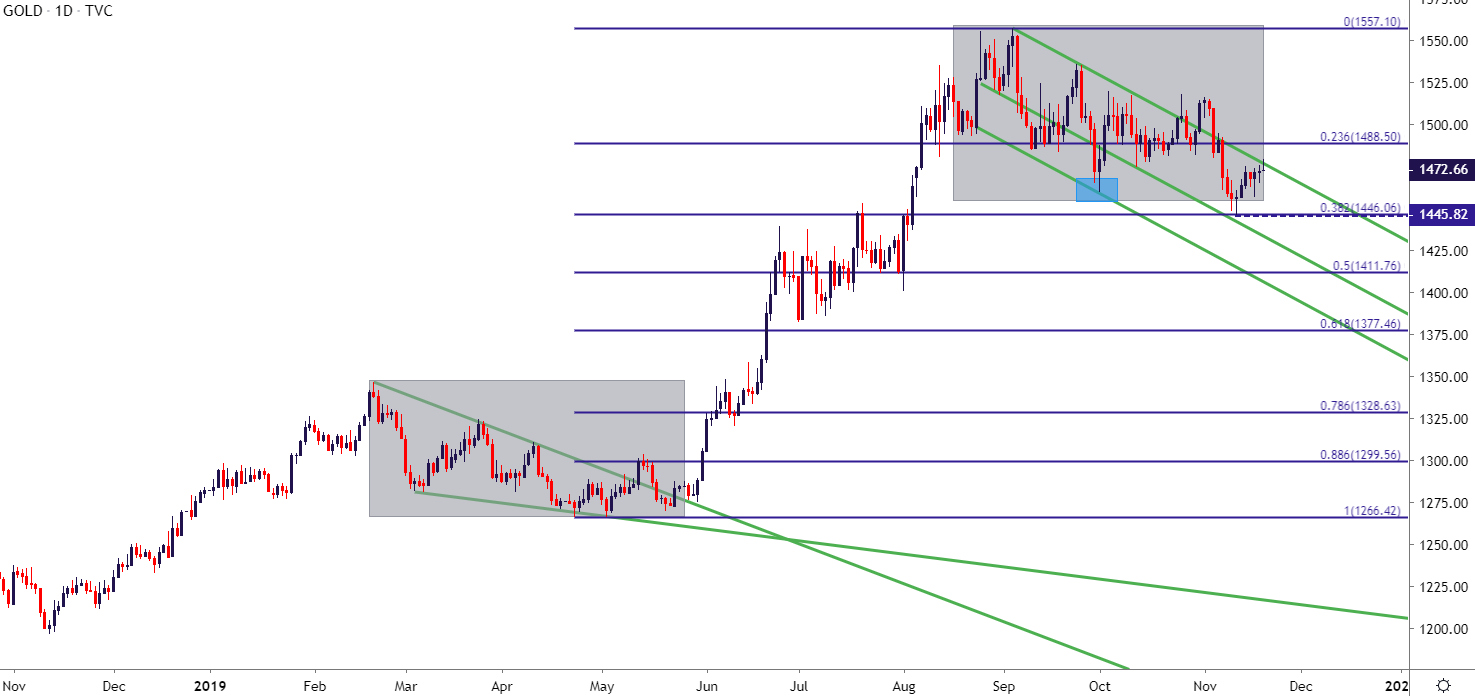
Chart prepared by James Stanley; Gold on Tradingview
Gold Price – Intermediate-Term
On a shorter-term basis, the pullback in Gold may have some room to run, particularly with the above noted observation of resistance showing at or around prior support in the 1475-1480 zone. For swing traders, a hold of resistance in this area can keep the door open for short-side setups, looking for a pullback down to 1466 followed by secondary target potential in the 1453-1460 zone.
Gold Price Four-Hour Chart

Chart prepared by James Stanley; Gold on Tradingview
Gold Price – Short Term
On an even shorter-term basis, the look could go back to the bullish side as a series of higher-highs and higher-lows over the past week has yet to break down. That theme has been thwarted at the above-noted resistance zone but buyers have yet to relent, holding higher-low support and this can keep the door open for short-term bullish scenarios.
Gold Hourly Price Chart
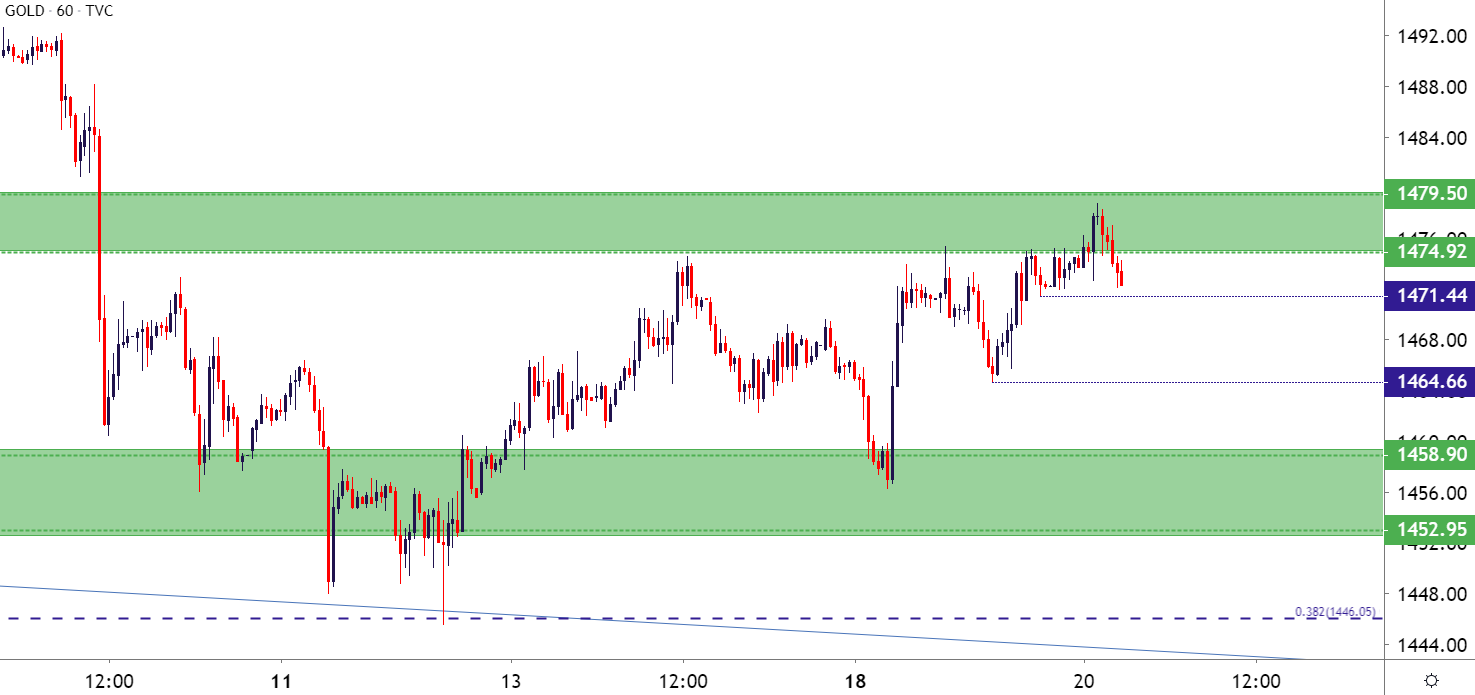
Chart prepared by James Stanley; Gold on Tradingview
To read more:
Are you looking for longer-term analysis on the U.S. Dollar? Our DailyFX Forecasts have a section for each major currency, and we also offer a plethora of resources on Gold or USD-pairs such as EUR/USD, GBP/USD, USD/JPY, AUD/USD. Traders can also stay up with near-term positioning via our IG Client Sentiment Indicator.
Forex Trading Resources
DailyFX offers an abundance of tools, indicators and resources to help traders. For those looking for trading ideas, our IG Client Sentiment shows the positioning of retail traders with actual live trades and positions. Our trading guides bring our DailyFX Quarterly Forecasts and our Top Trading Opportunities; and our real-time news feed has intra-day interactions from the DailyFX team. And if you’re looking for real-time analysis, our DailyFX Webinars offer numerous sessions each week in which you can see how and why we’re looking at what we’re looking at.
If you’re looking for educational information, our New to FX guide is there to help new(er) traders while our Traits of Successful Traders research is built to help sharpen the skill set by focusing on risk and trade management.
--- Written by James Stanley, Strategist for DailyFX.com
Contact and follow James on Twitter: @JStanleyFX


