


US Dollar Talking Points:
- The US Dollar has been fairly range-bound this week following an early-November retracement in the Q4 sell-off.
- GBPUSD is nearing a re-test of the 1.3000 level while AUDUSD remains perilously close to the .6700 support. USDCAD remains in view today with this morning’s economic calendar bringing the fireside chat with BoC Governor, Stephen Poloz.
- DailyFX Forecasts are published on a variety of markets such as Gold, the US Dollar or the Euro and are available from the DailyFX Trading Guides page. If you’re looking to improve your trading approach, check out Traits of Successful Traders. And if you’re looking for an introductory primer to the Forex market, check out our New to FX Guide.
US Dollar Price Action Calms After Early-November Pullback
It’s been a calmer week so far in the US Dollar as the currency has traded within a fairly tight range so far. After falling on Monday to continue the Thursday/Friday sell-off from last week, support came in at the 23.6% retracement of the October bearish move and has since helped to hold the lows. Buyers haven’t exactly made a loud entry back into the market, however, as a quick blip of strength on Tuesday and Wednesday remained constrained by a longer-term zone of resistance that runs from 97.86-97.94.
This leaves the US Dollar in an interesting spot as we’re now just past the halfway point in Q4. The October sell-off looms large and carries continuation potential as the early-November pullback was rebuffed at the 50% retracement of that major move. The three-month-low is around a double bottom formation in the 97.11 vicinity; and if sellers can pose a push beyond that level another longer-term Fibonacci level comes into view at 96.47.
US Dollar Daily Price Chart

Chart prepared by James Stanley; US Dollar on Tradingview
Taking a step back to look at the big picture and the bearish side of the scenario becomes that much more interesting. It’s been a net move of strength in the US Dollar so far this year, with DXY catching a support test off the 95.00 level in the first full week of the year. But buyers haven’t exactly been invigorated, as each push up to fresh highs has been accompanied with trepidation and often followed by a pullback. This led into the build of a rising wedge pattern, which will often be approached with the aim of bearish reversals. That began to fill-in during October and through the FOMC’s most recent rate cut. But early November brought pullback in that scenario as looked at above, and that longer-term bearish theme remains in the waiting room as sellers have yet to retake control of the matter with fresh lows.
US Dollar Weekly Price Chart

Chart prepared by James Stanley; US Dollar on Tradingview
US Dollar Strategy Options
As looked at yesterday, both GBPUSD and AUDUSD present some interest on either side of the US Dollar with major support/resistance levels nearby. In Cable, the pair has remained fairly resilient following the October breakout, driven in-large part by positive developments around Brexit. The 1.3000 level came into play and has since helped to hold the highs through a few different bullish flares. I had looked at support in the pair earlier this week, basing off of a confluent zone in the 1.2900-area and that’s since come in to define support. Price action, at this point, is in a fairly tough spot to argue for bullish trend strategies considering the 1.3000 level is so nearby. So, this would leave the trader with two options for moving forward: Either looking to trade topside breakouts in the event that 1.3000 is taken out or, alternatively, waiting for another pullback to support.
GBPUSD Four-Hour Price Chart

Chart prepared by James Stanley; GBPUSD on Tradingview
AUDUSD on the other hand has remained relatively weak over the past few trading days, even with that general tone of selling in the US Dollar. This is likely being driven in-part by skepticism around a US-China trade deal, and this can keep the door open as an attractive option for working with USD-strength.
Earlier this month a longer-term trendline came into play to help hold the highs. That bearish reaction in the pair pushed prices down to fresh three-week-lows but, as yet, sellers haven’t been able to re-encroach upon the .6750 psychological level. The big question here is on the bearish breakout: The support zone around the .6700 level has been tested multiple times in the past few months but has yet to give way. This is a fresh decade-low in the AUD/USD, and if sellers are able to elicit a fifth test in the near-term, there may be further downside potential.
AUDUSD Daily Price Chart
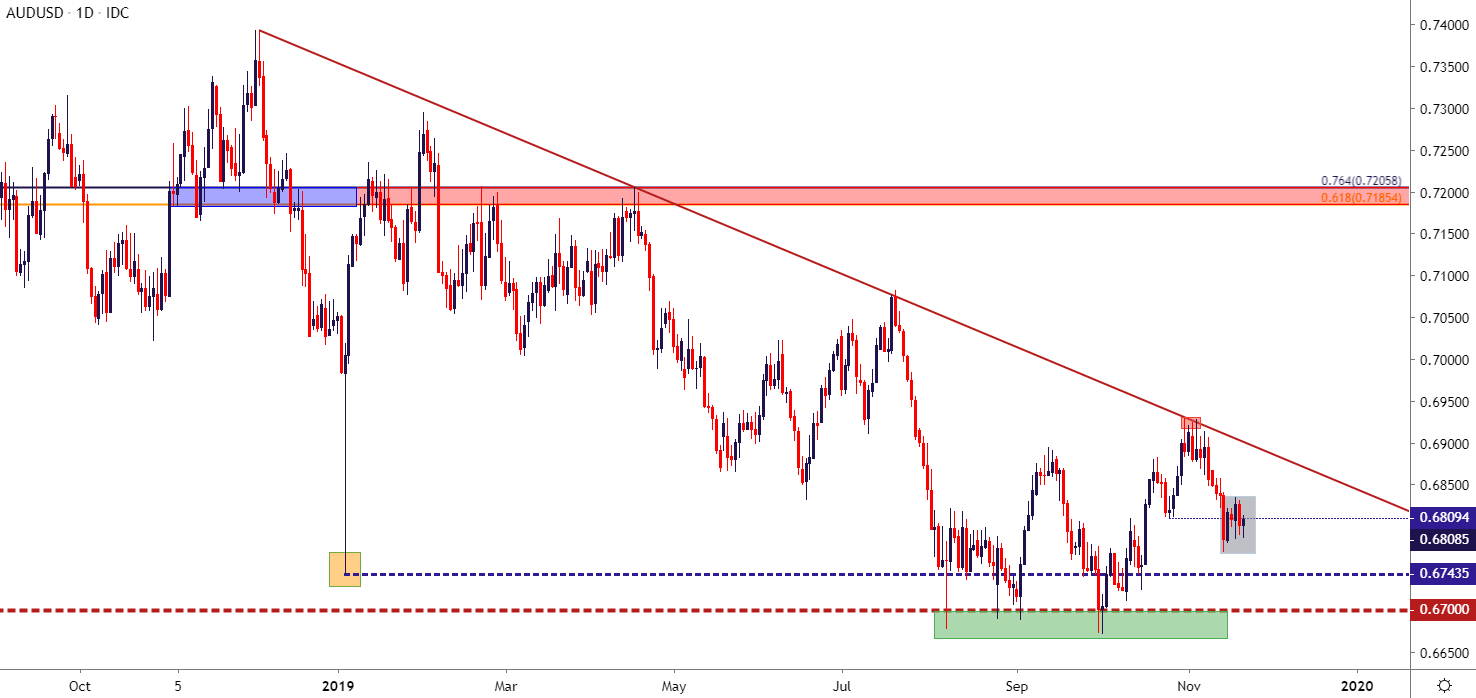
Chart prepared by James Stanley; AUDUSD on Tradingview
USDCAD Fresh Monthly Highs Ahead of the Fireside Chat
The big item on the economic calendar for today is the fireside chat with BoC Governor Stephen Poloz. The USD/CAD pair has been on the move of recent, helped on Tuesday by some comments from BoC Deputy Governor Carolyn Wilkins. USD/CAD broke-out to fresh monthly highs, trading above the 1.3300 level, and after a check back for higher-low support, buyers have continued to hold the lows.
This sets the pair up in a fairly interesting position. If Poloz does take on a dovish tone as he has of recent, USD/CAD may have some further gains in its future. But – overhead is an imposing series of resistance levels that can keep the door open for short-side swings, particularly if USD-weakness comes in as a prominent theme in continued Q4 trade.
USDCAD Eight-Hour Price Chart
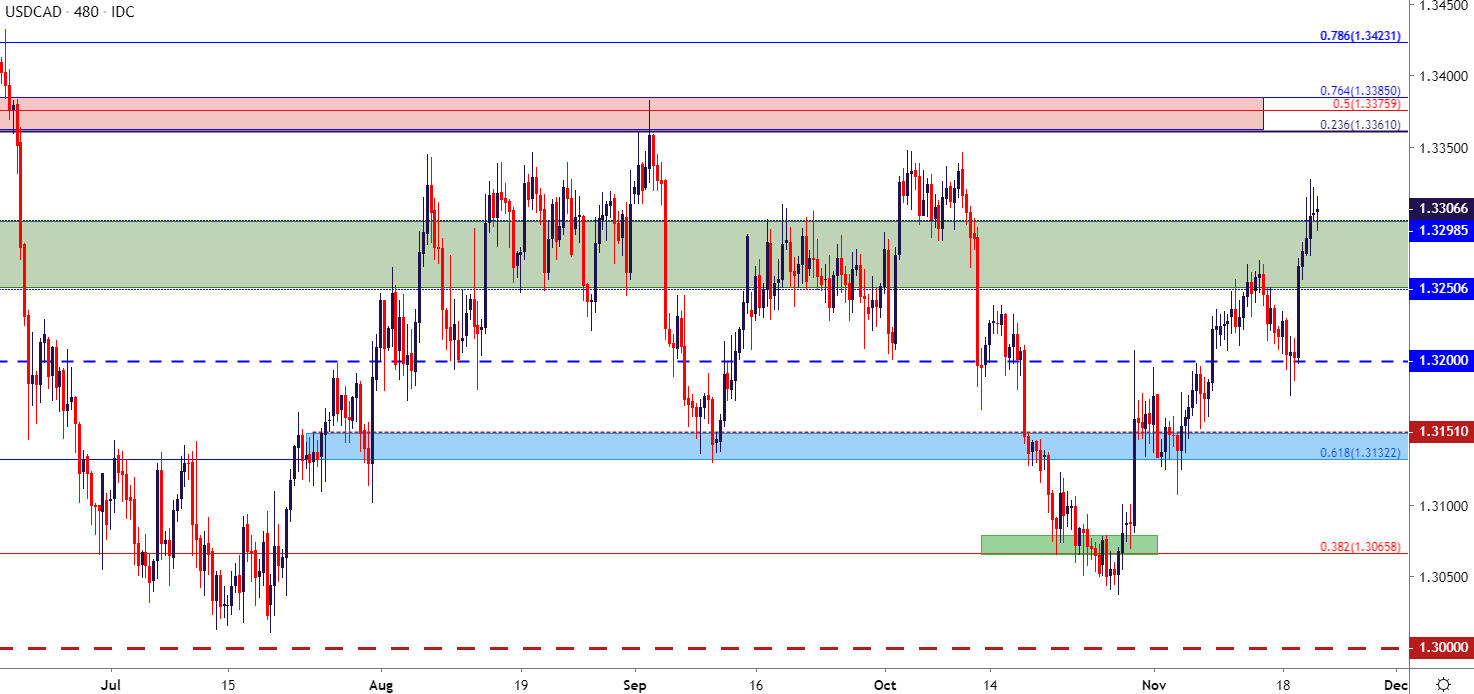
Chart prepared by James Stanley; USDCAD on Tradingview
To read more:
Are you looking for longer-term analysis on the U.S. Dollar? Our DailyFX Forecasts have a section for each major currency, and we also offer a plethora of resources on Gold or USD-pairs such as EUR/USD, GBP/USD, USD/JPY, AUD/USD. Traders can also stay up with near-term positioning via our IG Client Sentiment Indicator.
Forex Trading Resources
DailyFX offers an abundance of tools, indicators and resources to help traders. For those looking for trading ideas, our IG Client Sentiment shows the positioning of retail traders with actual live trades and positions. Our trading guides bring our DailyFX Quarterly Forecasts and our Top Trading Opportunities; and our real-time news feed has intra-day interactions from the DailyFX team. And if you’re looking for real-time analysis, our DailyFX Webinars offer numerous sessions each week in which you can see how and why we’re looking at what we’re looking at.
If you’re looking for educational information, our New to FX guide is there to help new(er) traders while our Traits of Successful Traders research is built to help sharpen the skill set by focusing on risk and trade management.
--- Written by James Stanley, Strategist for DailyFX.com
Contact and follow James on Twitter: @JStanleyFX


