


Stocks are in bounce mode but don’t have the kind of momentum coming out of a low that suggests it is more than just a bounce; watch how the S&P treats the high end of the range it is building. Crude oil is a tough handle, but the outlook still smacks of lower prices; Brent contract in focus. Gold is holding well following a strong rejection from resistance, some more patience may be required before getting a good look.
Technical Highlights:
- S&P 500 working towards resistance, at risk of downturn
- Crude oil tough, but has generally weak posturing
- Gold price holding up well, more time needed
Make more informed decisions by checking out our trading forecasts and educational resources on the DailyFX Trading Guides page.
S&P 500 working towards resistance, at risk of downturn
The S&P 500 has been bouncing around lately following the swoon from record levels. Generally, it smacks of bearish behavior, but we need to wait for a bit more confirmation before running with a full-on short bias. The top of the developing range could offer traders a fade-trade, eyeing the 2943 cash level. A swift turn down from there will help cement the notion that another sizable leg lower may soon be in the works.
S&P 500 Daily Chart (watch range resistance)

Crude oil tough, but has generally weak posturing
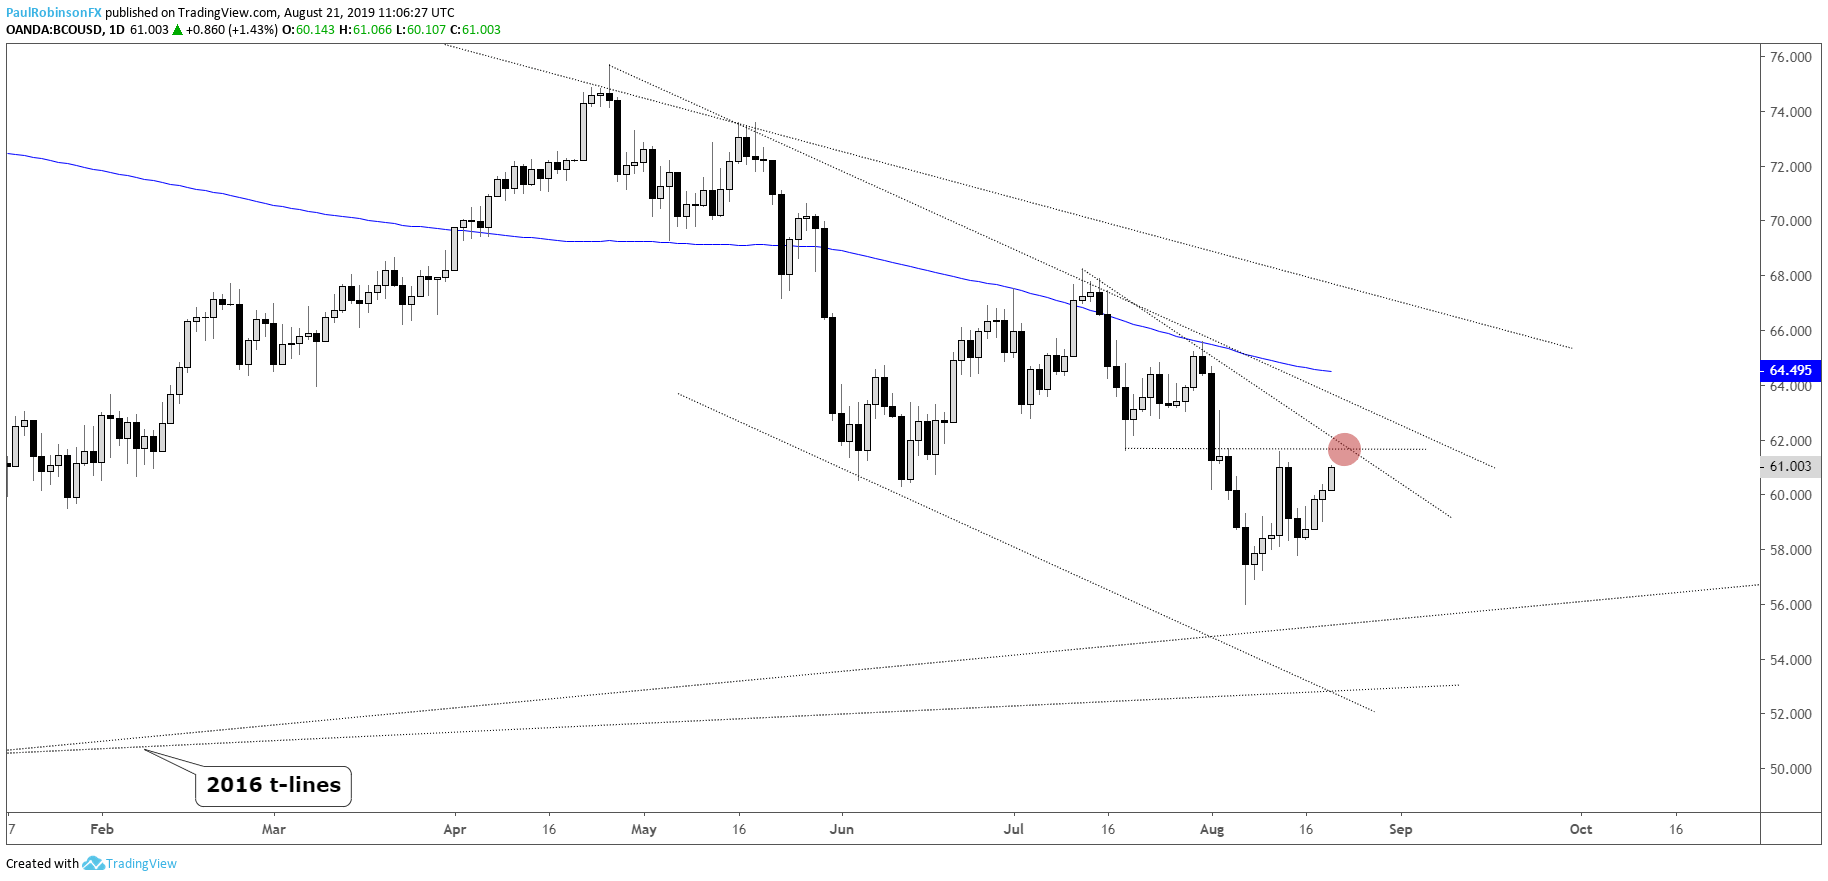
The Brent contract is weaker than its U.S. counterpart, WTI, and on that it is of more interest given the weakfish tilt to the charts. Resistance is at hand, and a turn lower will help further along the notion that another swing lower, towards the 2016 trend-lines, is in the works. If a turn lower develops, watch the short-term trend-line (with multiple touches), a break will undermine oil further and could put the shorts in the driver’s seat.
Brent Crude Oil Daily Chart (trend, resistance against it)
Brent Crude Oil Hourly Chart (watch t-line on turn down)
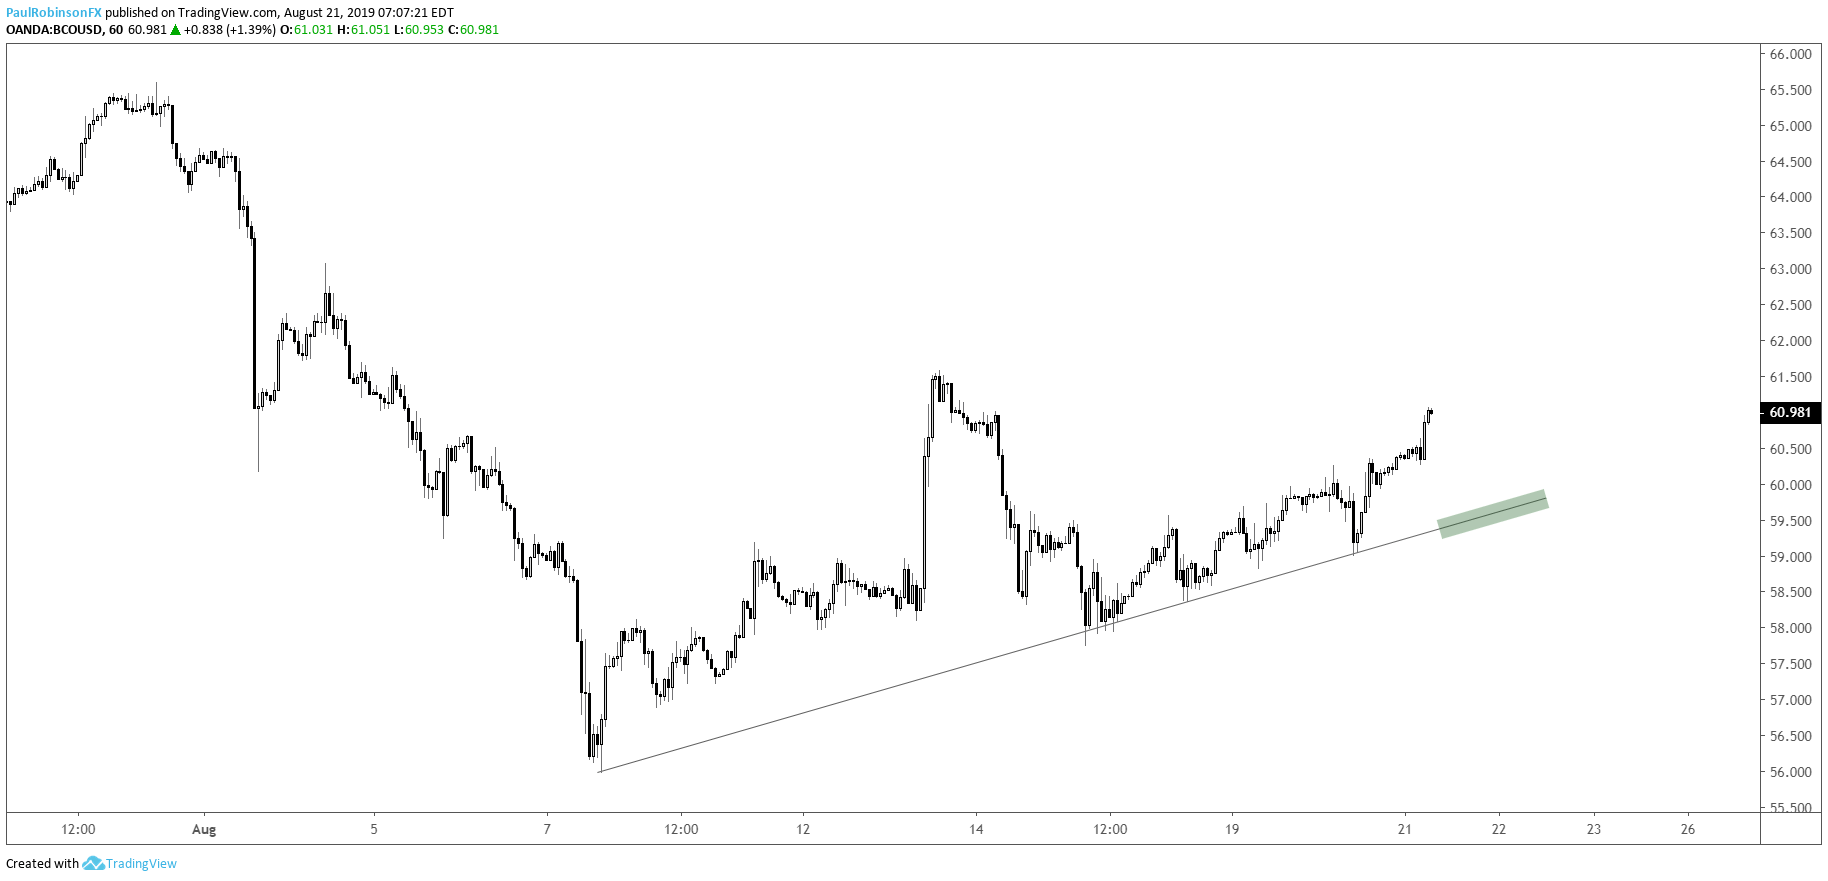
Brent Crude Oil Chart by Tradingview
Gold price holding up well, more time needed
Since last week’s violent trading session at major long-term resistance gold has held up well, digesting gains in a bullish fashion. It could use a bit more time, but in general gold is poised to rally further. It just may take some time to get through the long-term resistance zone extending up to 1575.
Gold Price Chart (consolidating well)
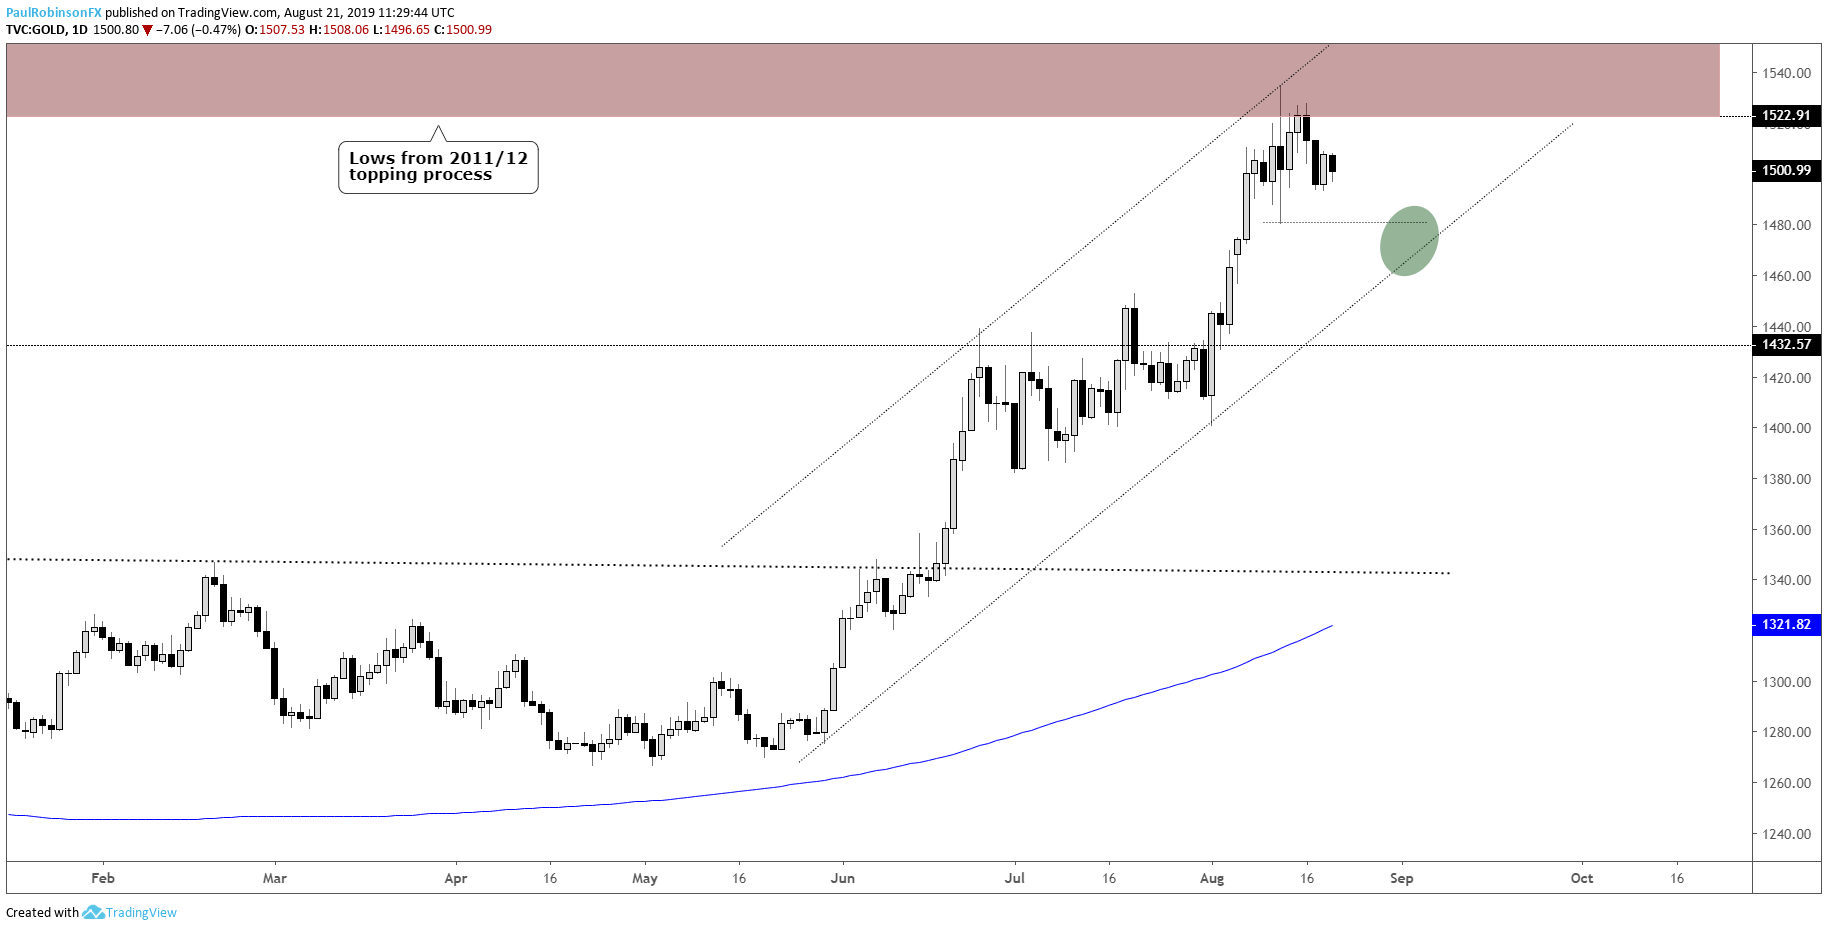
Gold Price Chart by Tradingview
Resources for Index & Commodity Traders
Whether you are a new or an experienced trader, DailyFX has several resources available to help you; indicator for tracking trader sentiment, quarterly trading forecasts, analytical and educational webinars held daily, and trading guides to help you improve trading performance.
We also have a series of guides for those looking to trade specific markets, such as the S&P 500, Dow, DAX, gold, silver, crude oil, and copper.
---Written by Paul Robinson, Market Analyst
You can follow Paul on Twitter at @PaulRobinsonFX


