


USD, EURUSD, GBPUSD, USDCAD, AUDUSD Talking Points:
- The next two weeks bring key rate decisions out of both Europe and the US. The prospect of looser monetary policy is on the table for each, but the big question is what else each respective bank might do out of a single rate cut?
- The US Dollar has been on a ride of late, as last week’s Williams-fueled sell-off has been entirely faded out of the market after the New York Fed clarified his comments. The USD has since caught an aggressive bid that’s pushed price action up to a key area of resistance at 97.70.
- DailyFX Forecasts are published on a variety of markets such as Gold, the US Dollar or the Euro and are available from the DailyFX Trading Guides page. If you’re looking to improve your trading approach, check out Traits of Successful Traders. And if you’re looking for an introductory primer to the Forex market, check out our New to FX Guide.
US Dollar: Screaming Higher After NY Fed Clarifies Williams’ Comments
It’s been a strong comeback for the US Dollar after NY Fed President John Williams’ comments were walked back last week. In an off-hand remark, Mr. Williams had alluded to the bank being more responsive to slowing data. This was widely-inferred to mean that the FOMC was going to be more dovish-than-expected at their rate decision next week. But just as USD-weakness began to show prominently across pretty much all FX pairs, the NY Fed issued a ‘clarification’ that Mr. Williams was not talking about near-term monetary policy and was, instead, discussing long-term implications.
Odds for a 50-basis point cut at next week’s rate decision have fallen dramatically. After moving above 59% last Thursday after the announcement, probabilities are now showing at approximately 21%. Along with that less dovish expectation around the Fed has been a comeback of USD-strength, and as seen on the hourly chart below, the move has been near-parabolic as USD bulls have come rushing back.
US Dollar Hourly Price Chart

Chart prepared by James Stanley
Taking a step back, and the US Dollar is testing resistance at an interesting level. The price of 97.70 was the prior yearly high in the Greenback, and this is a level that had turned around bullish advances in November and December of last year, to go along with reversals in March and June in 2019. The months of April and May did see this level taken-out, albeit temporarily, as a double top built in around the 98.33 level.
Nonetheless, resistance showing at 97.70 can keep the door open for short-side swings; and as looked at in this week’s FX Setups, there are a couple of areas that could be a bit more attractive for that theme than others.
US Dollar Daily Price Chart
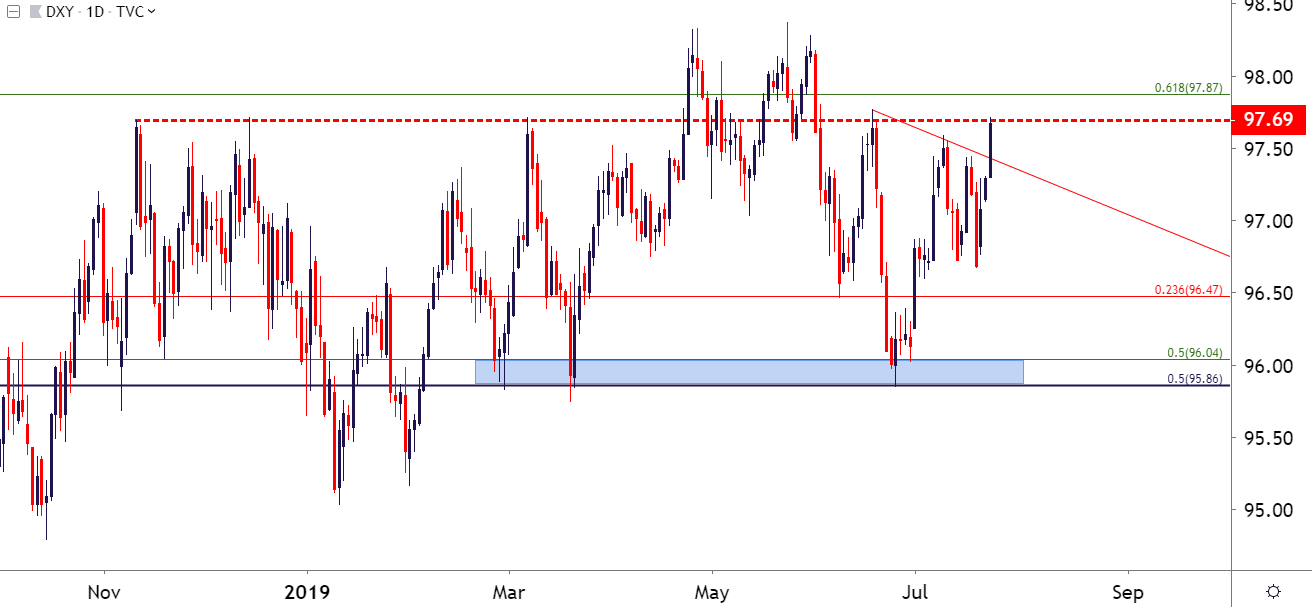
Chart prepared by James Stanley
EUR/USD Breaks Down to Fresh Lows on ECB QE Potential
Last week saw markets talking up the chance for a rate cut at this week’s ECB meeting. That didn’t seem to deter Euro bulls for defending support in the 1.1187-1.1212 zone. But, this week has brought in rumors that the ECB may be looking at another round of QE; and when combined with that comeback of USD-strength, prices in the pair have folded down to fresh seven-week-lows.
Making matters difficult is the fact that it can be difficult to plot profit targets too far below the 1.1100 zone that’s already produced a couple of recent bear traps in the pair. This makes the prospect of chasing the fresh breakdown as a bit more daunting. Instead, a short-term pullback to resistance at prior support could possibly re-open the door for as such. This was discussed earlier this morning, and that potential can remain ahead of the Thursday ECB meeting.
EUR/USD Hourly Price Chart

Chart prepared by James Stanley
Taking a step back, and the big item of interest here remains around 1.1100 and whether buyers jump in to defend the prior low. I had looked at the long side of the pair coming into this week and that play has since been stopped out with this support breach. But, if bulls can come in to produce a higher-low above the May swings around 1.1108 and 1.1115, the door could quickly re-open for bullish setups in the pair.
Should the ECB disappoint on Thursday, this becomes a more attractive scenario to work with.
EUR/USD Eight-Hour Price Chart
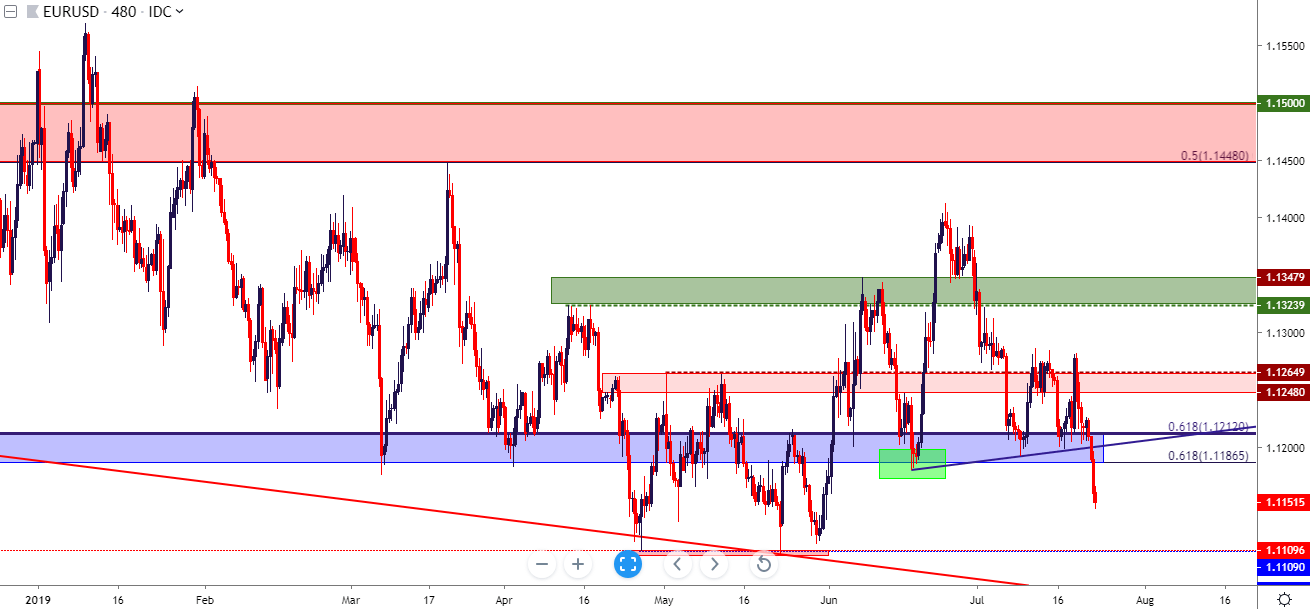
Chart prepared by James Stanley
GBP/USD Carries Bearish Potential
I had looked into the short-side of the pair coming into this week, largely looking for the prior theme of weakness to continue showing prominently if/when matched with USD-strength. As shown in the webinar, the first target is currently helping to hold this week’s lows; and this can create a difficult backdrop for chasing. There could be the potential for bearish breakout plays but, more attractively, a pullback to resistance at prior support could re-open the door for short-side setups. This runs from the 1.2500 level up to the 1.2523 Fibonacci level.
GBP/USD Two-Hour Price Chart

Chart prepared by James Stanley
USD/CAD Rips to Monthly Highs After Build of Falling Wedge
I had started to line this one up for reversal potential last week as the pair had built into a falling wedge formation. Sellers appeared reticent of a 1.3000 re-test and, sure enough, even as USD-weakness was pricing in aggressively last week, the pair merely held the lows about 10 pips away from the big figure, and prices have since ripped-higher.
I had looked at this in this week’s FX Setups and prices have already jumped-up to the first target. The door could remain open for more with secondary target potential around the 1.3200 level. And if matters really pop off around the Fed, with USD-strength running wildly on a less-dovish Federal Reserve, the 1.3250-1.3300 area could soon come back into play.
USD/CAD Four-Hour Price Chart

Chart prepared by James Stanley
AUD/USD Snaps Back to .7000 Big Figure
On the side of USD-weakness, AUD/USD may remain of interest. As USD-weakness was pricing in aggressively around those comments from John Williams last week, AUD/USD flew up to fresh three-month-highs. As USD-strength has come back after the ‘clarification’ of those comments, AUD/USD has retraced around 50% of that prior topside move that started a couple of weeks ago. At this point, AUD/USD is testing support at the .7000 big figure, and a hold here keeps the door open for bullish swing potential against the US Dollar.
AUD/USD Two-Hour Price Chart
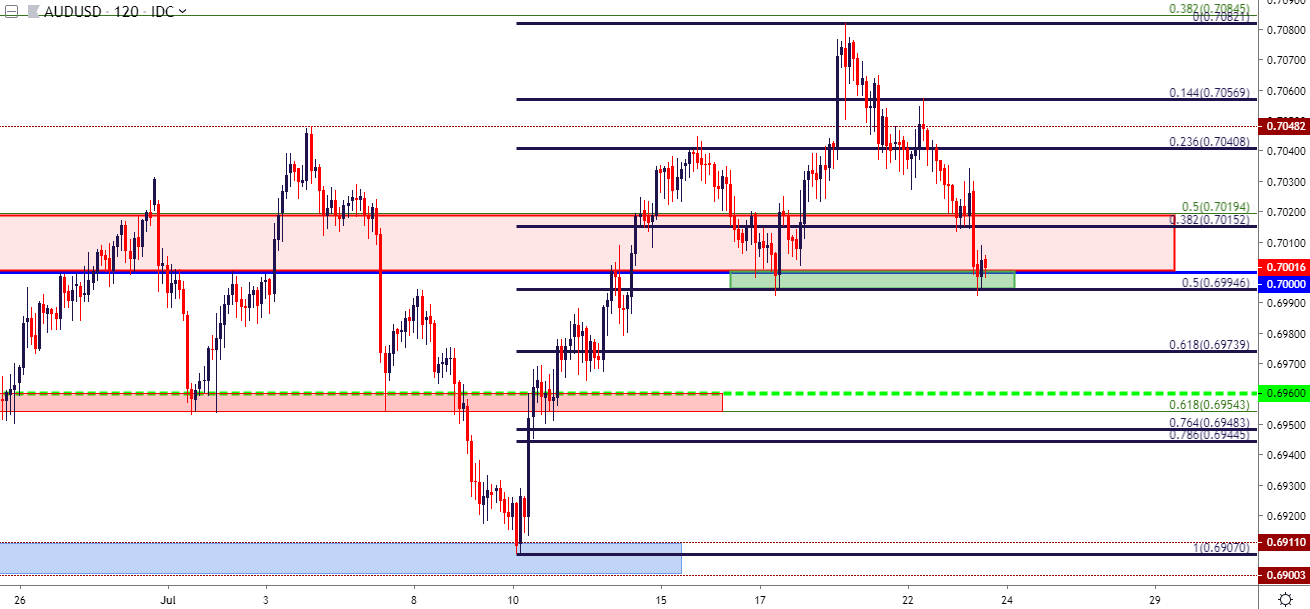
Chart prepared by James Stanley
USD/JPY Bounces in an Abbreviated Fashion
Above when looking at USD/CAD, I had offered a very simple deduction. When USD-weakness was pricing-in, that previously strong theme of USD/CAD weakness merely moved down to support. Despite the fact that USD/CAD was one of the cleaner short-USD themes ahead of the driver, that push did little to encounter support. This highlighted the brewing reversal potential in the pair that has since played out as themes around USD have shifted.
A similar deduction is showing now in USD/JPY. While the Dollar is running higher against most major currencies, USD/JPY is merely posing a bounce up towards prior resistance. This re-opens the door for resistance potential around the 108.47-108.80 area on the chart with the aim of short-side plays.
USD/JPY Four-Hour Price Chart
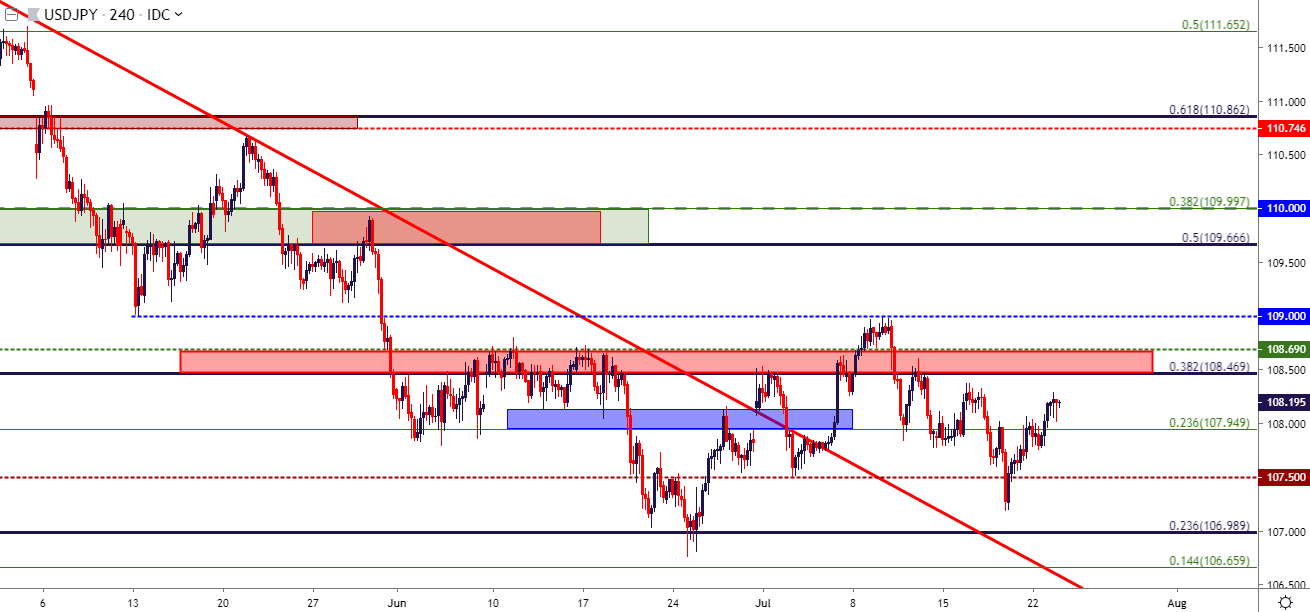
Chart prepared by James Stanley
To read more:
Are you looking for longer-term analysis on the U.S. Dollar? Our DailyFX Forecasts have a section for each major currency, and we also offer a plethora of resources on Gold or USD-pairs such as EUR/USD, GBP/USD, USD/JPY, AUD/USD. Traders can also stay up with near-term positioning via our IG Client Sentiment Indicator.
Forex Trading Resources
DailyFX offers an abundance of tools, indicators and resources to help traders. For those looking for trading ideas, our IG Client Sentiment shows the positioning of retail traders with actual live trades and positions. Our trading guides bring our DailyFX Quarterly Forecasts and our Top Trading Opportunities; and our real-time news feed has intra-day interactions from the DailyFX team. And if you’re looking for real-time analysis, our DailyFX Webinars offer numerous sessions each week in which you can see how and why we’re looking at what we’re looking at.
If you’re looking for educational information, our New to FX guide is there to help new(er) traders while our Traits of Successful Traders research is built to help sharpen the skill set by focusing on risk and trade management.
--- Written by James Stanley, Strategist for DailyFX.com
Contact and follow James on Twitter: @JStanleyFX


