US Dollar Price Action Talking Points:
- The US Dollar is attempting to claw back losses after last week’s reversal that followed a failed breakout at two-year-highs.
- This week’s economic calendar is rather light in the US, and the big attraction on the Central Bank front is tomorrow’s Bank of Canada interest rate decision.
- DailyFX Forecasts are published on a variety of currencies such as Gold, the US Dollar or the Euro and are available from the DailyFX Trading Guides page. If you’re looking to improve your trading approach, check out Traits of Successful Traders. And if you’re looking for an introductory primer to the Forex market, check out our New to FX Guide.
US Dollar Claws Back Reversal Losses After Last Week’s Failed Breakout
Last week was climactic in the Greenback, as the US currency pushed up for a fresh two-year-high that was quickly followed by a vigorous reversal. We had looked at that reversal theme in last Thursday’s webinar, and prices in USD pushed all the way down to the 50% marker of the prior bullish move before finding a bit of support around the 97.54 level. With a relatively quiet calendar out of the US for this week, this leaves technical themes to do their work, and this keeps the prospect of pullback scenarios in the cards after last week’s failure at fresh highs.
US Dollar Four-Hour Price Chart
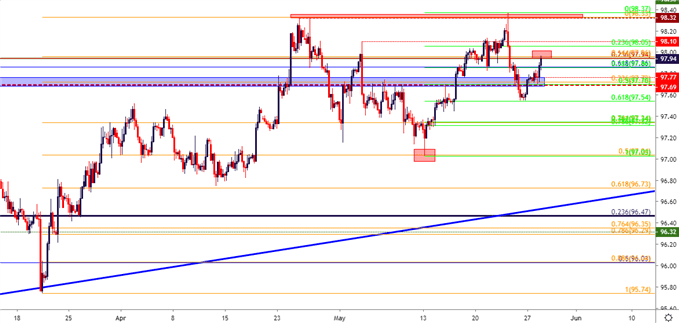
Chart prepared by James Stanley
USDJPY Postures Below Key Zone on the Chart
The 110.00 level has been of interest lately in USDJPY as last week saw prices push below this key area on the chart. This keeps USD/JPY in a bearish spot, although there may be need for a short-term pullback before the bearish side of the pair can become attractive again. The 110.00 level hasn’t yet been tested for lower-high resistance since last week’s break-below, and this can be extended down to the Fibonacci level at 109.67 to create a zone with which that lower-high resistance could be sought out. This setup syncs with ‘risk aversion’ themes, and if sellers do take another swing at equities later this week, the short-side of USDJPY can remain as attractive.
USDJPY Eight-Hour Price Chart
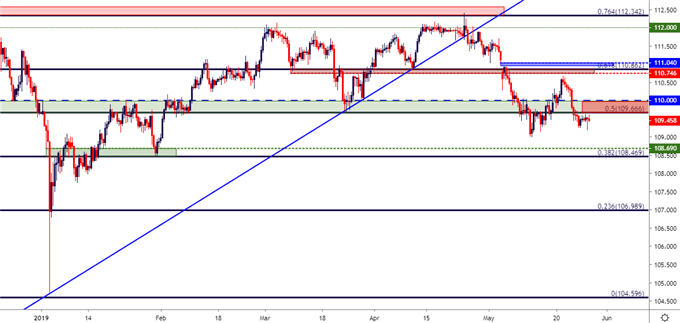
Chart prepared by James Stanley
AUDUSD Reversal Prospects
I had charted this setup around last week’s open, largely looking for AUDUSD to grasp on to support after gapping-higher to start the week. A dovish RBA rate decision shortly after helped to push prices back down to support, quickly filling that gap; but buyers held the line and prices respected the prior low. Now price action in the pair is putting in shorter-term higher-highs and higher-lows, keeping the door open for bullish short-term trend scenarios and longer-term reversal backdrops.
AUDUSD Two-Hour Price Chart
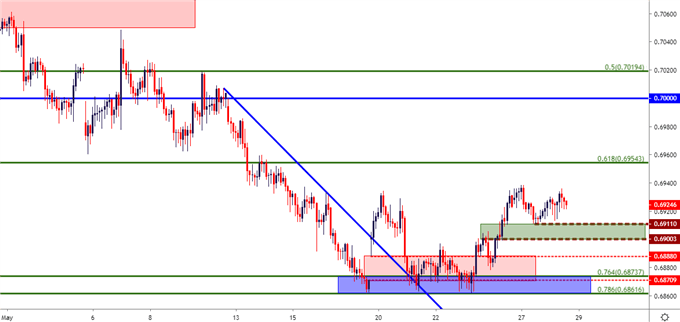
Chart prepared by James Stanley
NZDUSD Reversal Prospects
Similar as the above in AUD/USD with the exception of longer-term support backdrops. NZDUSD has rallied back-above the psychological .6500 level, and so far this week higher-low support has held around an area of prior resistance. This can similarly keep the door open for short-term bullish trends and longer-term reversal swings.
NZDUSD Four-Hour Price Chart
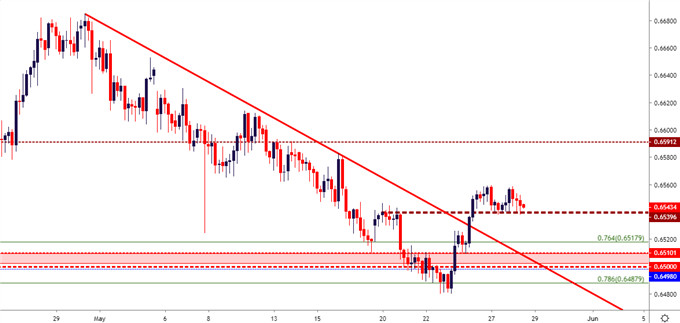
Chart prepared by James Stanley
USDCAD Rallies to Range Resistance Ahead of BoC Rate Decision
Tomorrow brings a Bank of Canada rate decision. Last month’s event saw USDCAD flicker up to a fresh high of 1.3520 in the aftermath, driven largely by a less-hawkish BoC than what was expected. And while the Bank of Canada doesn’t soon look to be raising rates, are they at the precipice of cutting? That’s the big question for tomorrow and in USDCAD, the pair remains range-bound. I had looked into the matter earlier this morning in the article entitled, Canadian Dollar Price Outlook: USD/CAD Rally to Resistance Before BoC.
USDCAD Four-Hour Price Chart
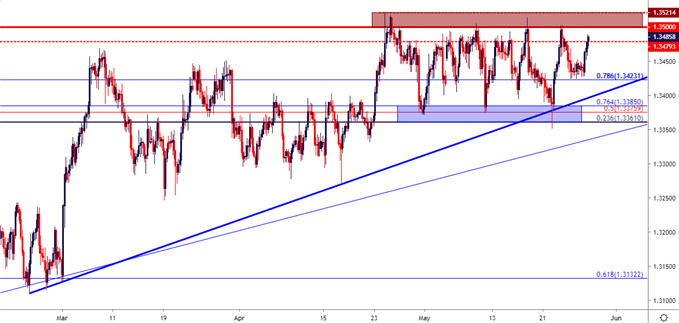
Chart prepared by James Stanley
EURUSD Survives Parliamentary Elections: Delayed Response or Bear Trap?
I had looked into this one earlier today, as well, in the article entitled, Euro Price Outlook: Fundamental Fireworks, Technical Impasse. This weekend saw a series of elections take place through Europe in this recent round of Parliamentary elections, and in places like Italy and France, ‘non-market friendly outcomes’ showed up but, to date, markets haven’t really shown much fear on that theme. As discussed earlier this morning, while this doesn’t necessarily rule out a delayed response type of scenario, it also keeps alive the potential for a bear trap in markets like the Euro.
EURUSD put in a false breakout last week. Prices quickly pushed back up to resistance at prior support and at the time of the webinar, it looked like bears were going to take another swing. But, as discussed, risk-reward dynamics on short-term plays were lackluster, leaving the trader to wait for a cleaner setup on the short-side of the move.
EURUSD Four-Hour Price Chart
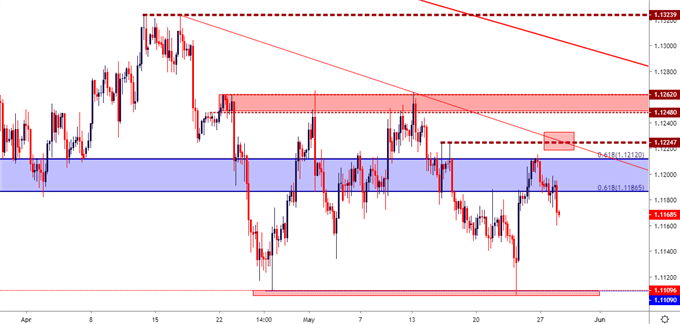
Chart prepared by James Stanley
Oil Price Bounces from Key Level, but Are Bears Finished?
Crude Oil prices have been on the move of recent: Last week, I had looked at the Fibonacci level around 57.47 in WTI Crude Oil. That support zone has since helped to hold the lows, and prices are pushing back towards the 60-handle. This doesn’t necessarily rule out the short-side, however, and this opens the door for a big zone of resistance potential that runs from 59.64-60.35; and a hold there keeps the door open for bearish strategies in WTI Crude Oil.
WTI Crude Oil Price Four-Hour Chart
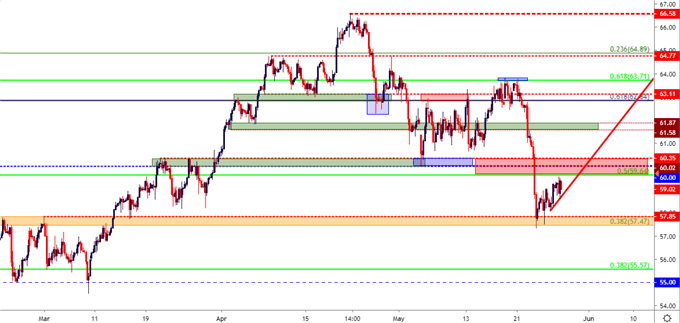
Chart prepared by James Stanley
To read more:
Are you looking for longer-term analysis on the U.S. Dollar? Our DailyFX Forecasts have a section for each major currency, and we also offer a plethora of resources on Gold or USD-pairs such as EUR/USD, GBP/USD, USD/JPY, AUD/USD. Traders can also stay up with near-term positioning via our IG Client Sentiment Indicator.
Forex Trading Resources
DailyFX offers an abundance of tools, indicators and resources to help traders. For those looking for trading ideas, our IG Client Sentiment shows the positioning of retail traders with actual live trades and positions. Our trading guides bring our DailyFX Quarterly Forecasts and our Top Trading Opportunities; and our real-time news feed has intra-day interactions from the DailyFX team. And if you’re looking for real-time analysis, our DailyFX Webinars offer numerous sessions each week in which you can see how and why we’re looking at what we’re looking at.
If you’re looking for educational information, our New to FX guide is there to help new(er) traders while our Traits of Successful Traders research is built to help sharpen the skill set by focusing on risk and trade management.
--- Written by James Stanley, Strategist for DailyFX.com
Contact and follow James on Twitter: @JStanleyFX


