


U.S. stocks remain in a precarious position with long-term moving averages coming into play. Crude oil is sitting on confluent support, but price action suggests that may not last much longer, especially if risk appetite continues to sour. Gold broke out above confluent trend-lines; the trading bias is higher with a swing-high from last month to watch as resistance in the days ahead…
Technical Highlights:
- Dow Jones trading around the 200-day, S&P 500 not yet there
- Crude oil at confluent support, but price action is weak
- Gold price looking to make good on Monday’s advance
Make more informed decisions by checking out our trading forecasts and educational resources on the DailyFX Trading Guides page.
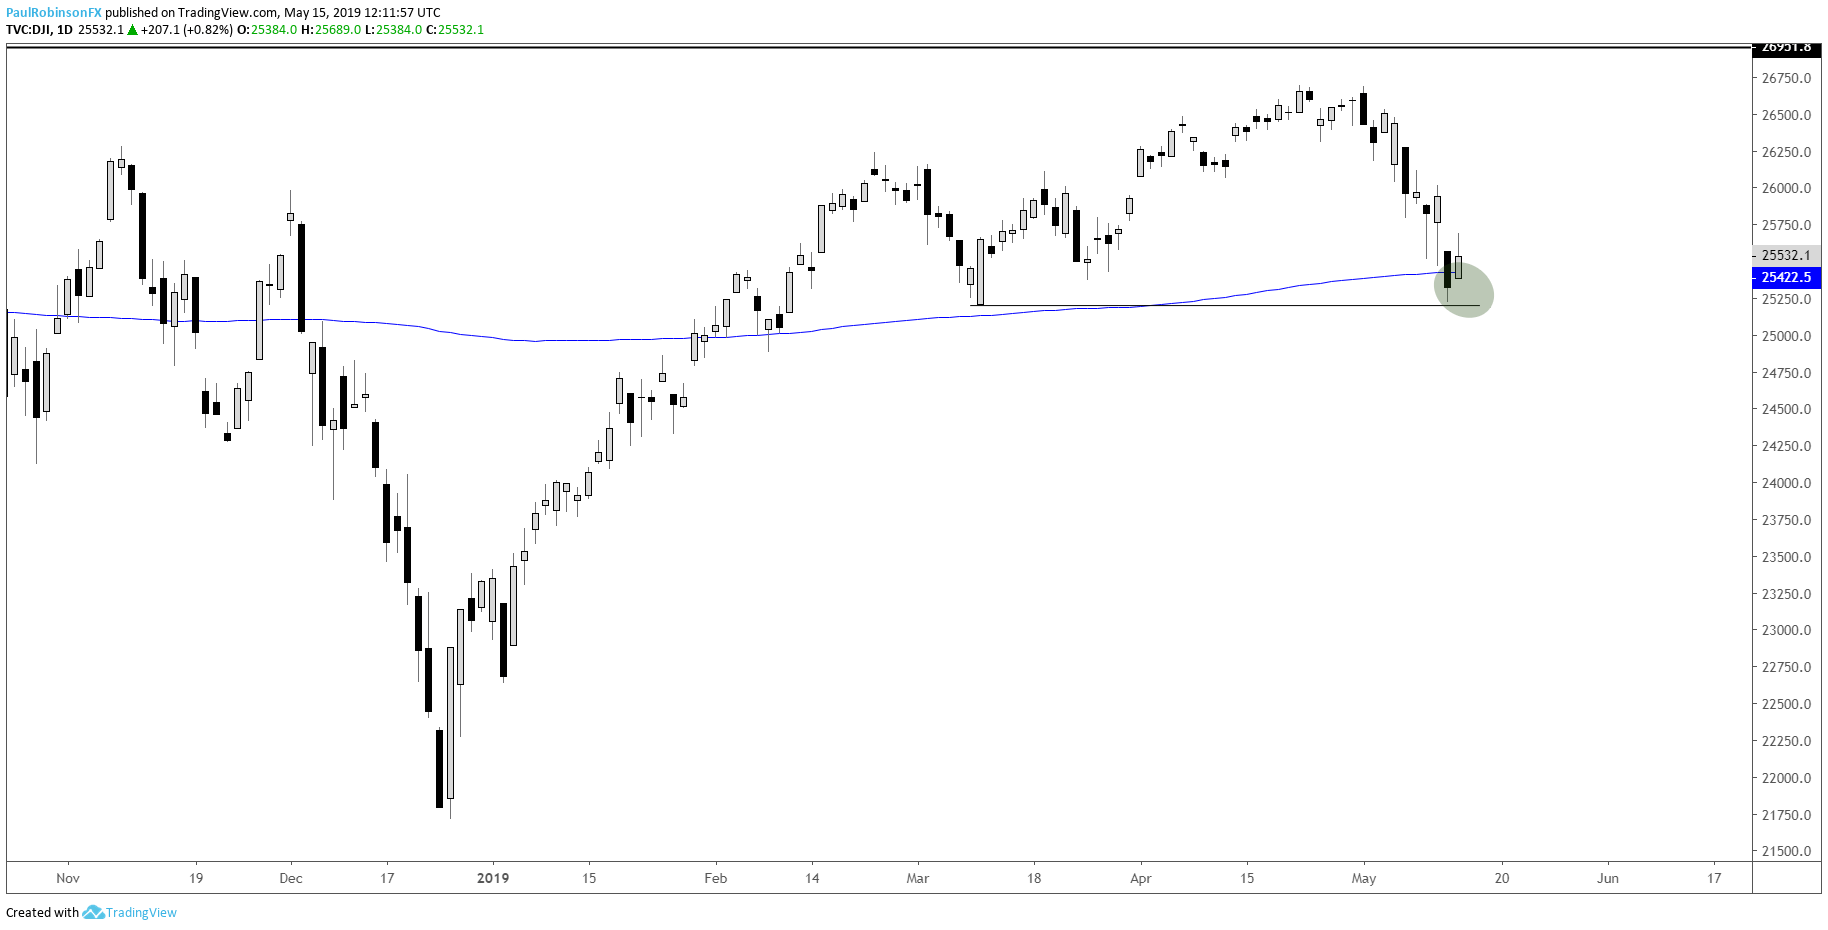
Dow Jones trading around the 200-day, S&P 500 not yet there
The Dow Jones broke the 200-day MA on Monday but only by a small amount. Yesterday’s bounce took it back above the widely-watched average, but not in the most convincing fashion. There is a bit of price support not far below the 200 at 25208, which provides a zone of support for now. But with the reaction so far limited and the S&P 500 having over 2% more to go before it reaches its own 200, the Dow might soon be extending below nearby levels.
Dow Jones Daily Chart (200-day, price support under fire)
Check out the Q2 Equities Forecast for the intermediate-term fundamental and technical outlook.
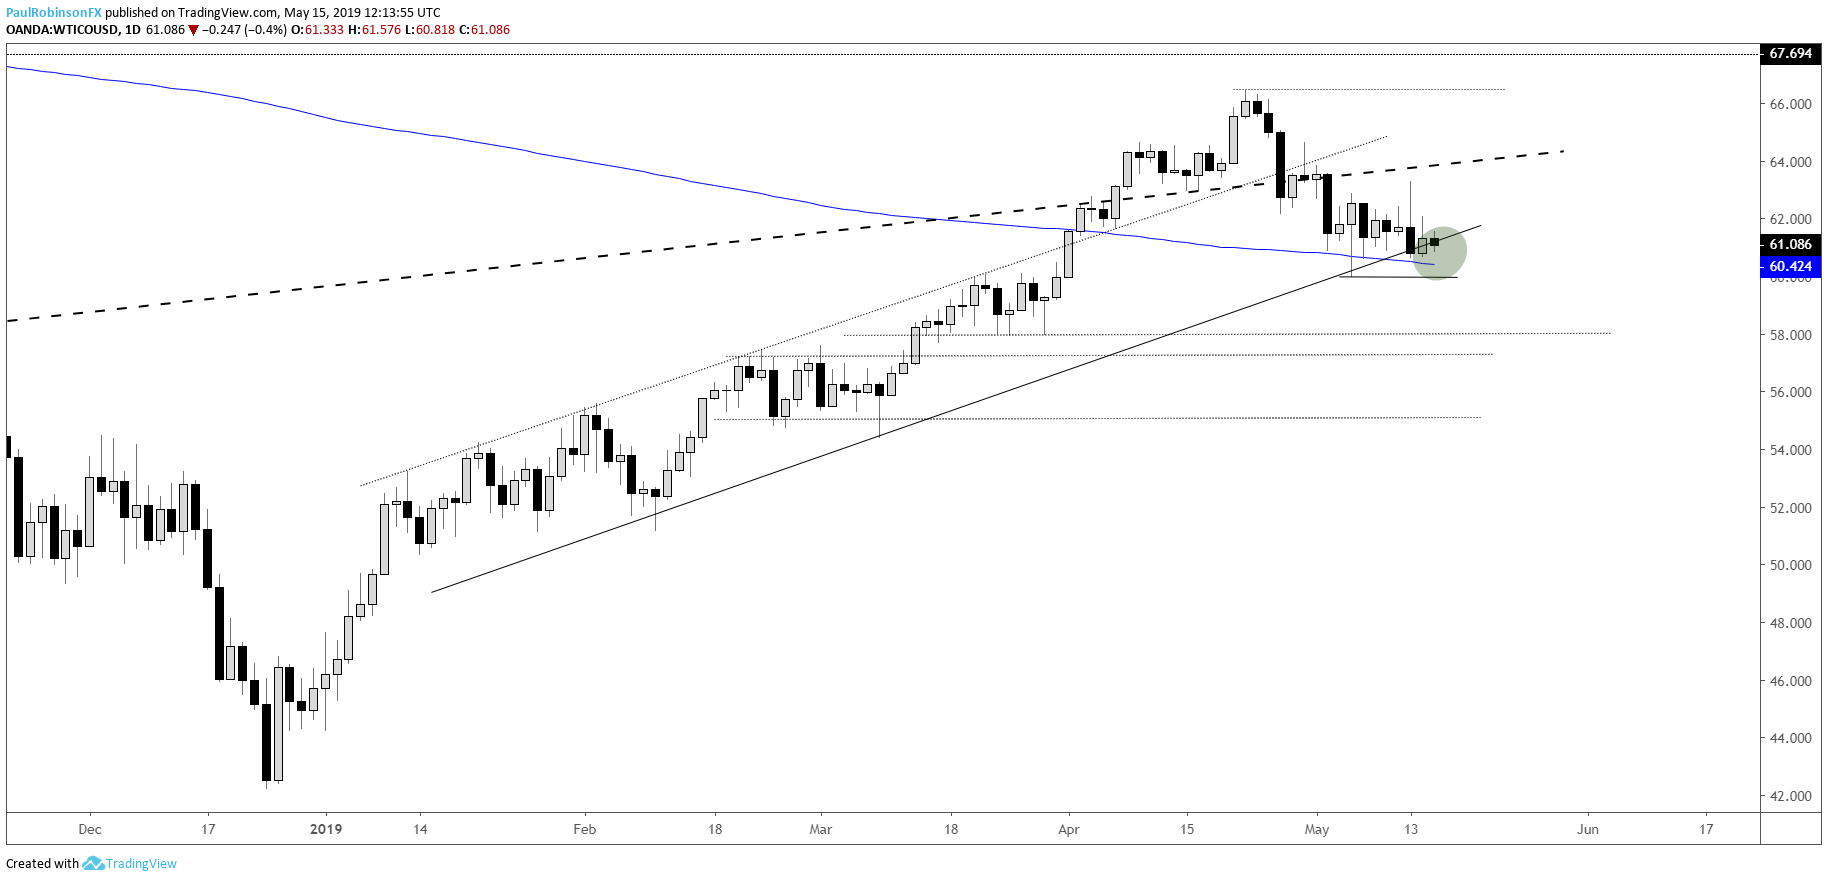
Crude oil at confluent support, but price action is weak
Back on May 6 crude oil posted an aggressive reversal at a confluence of support arriving by way of the 200-day MA and lower parallel extending higher since February. However, a lack of follow-through and an equally strong bearish reversal candle posted on Monday have support under siege. A break below 59.98 will put price below all support levels and have oil in danger of dropping another $2-5 from there.
Crude Oil Daily Chart (weak so far at confluent support)
Check out the Q2 Crude Oil Forecast for the intermediate-term fundamental and technical outlook.
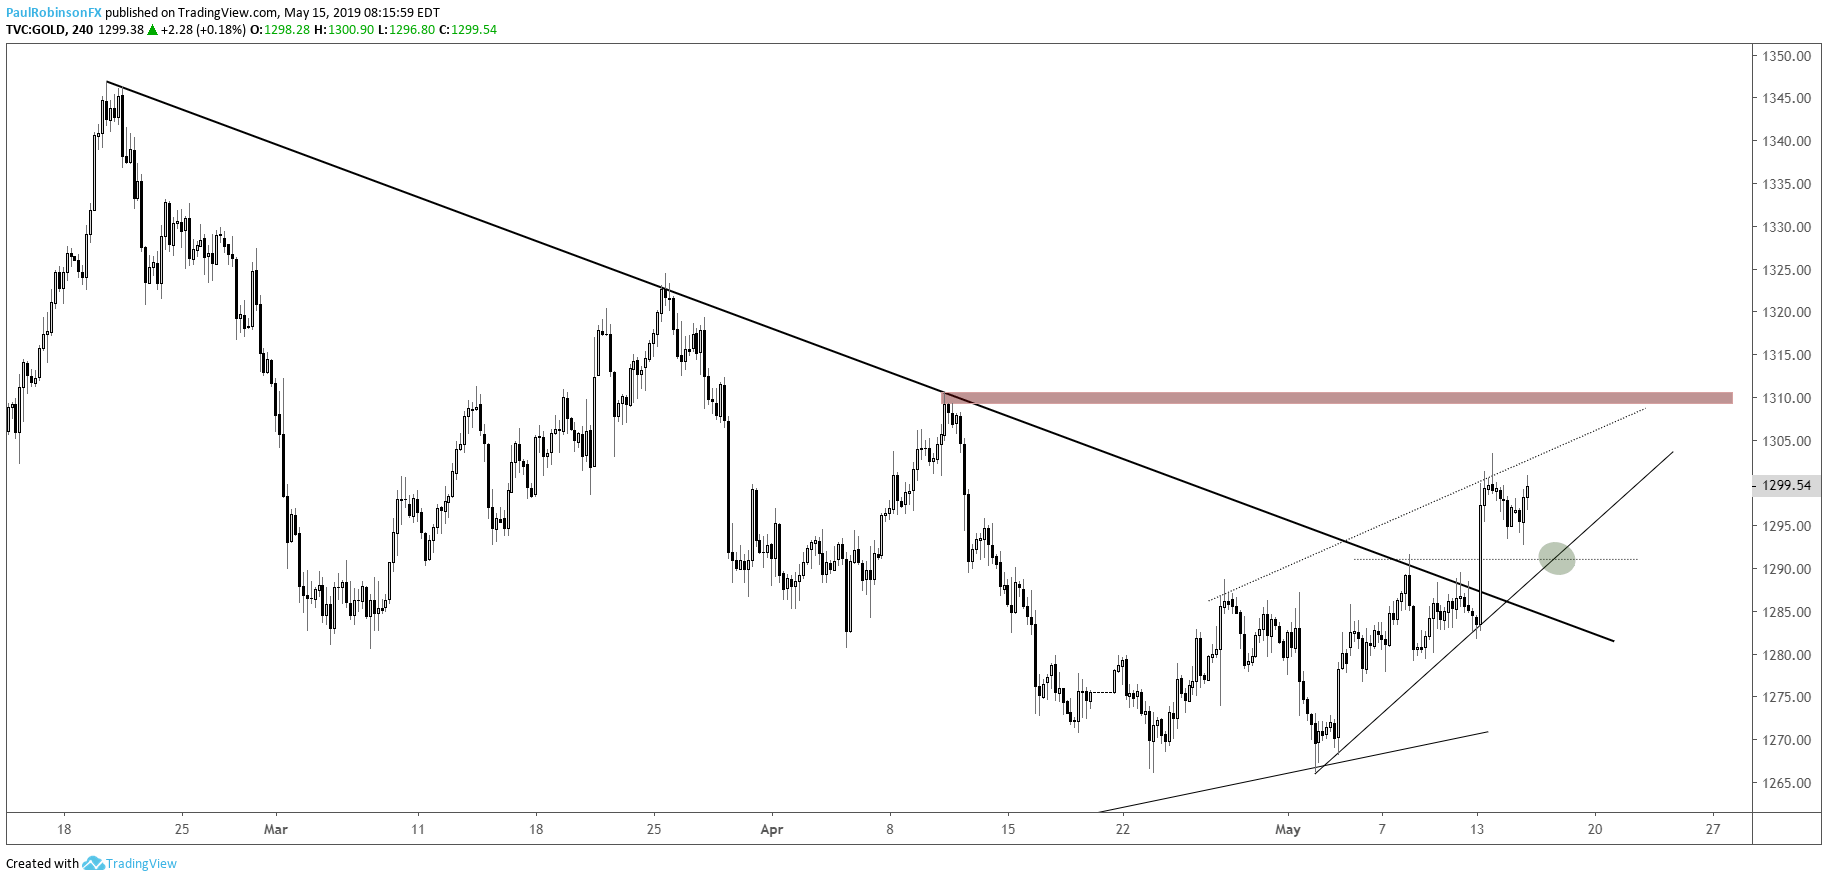
Gold price looking to make good on Monday’s advance
On Monday, gold ripped through confluent resistance and is looking to make good on the advance as it steadies itself after the advance. Looking to the 4-hr chart, a solid spot to look for a pullback to hold at would be the trend-line running up from the monthly low and May 8 high around 1291. However, gold might not give us that good look at support if stocks start selling off aggressively again and buyers quickly show up. The first top-side objective in any event is the 1308/10-area.
Gold Price 4-hr Chart (looking towards 1308/10 next)
Check out the Q2 Gold Forecast for the intermediate-term fundamental and technical outlook.
Resources for Index & Commodity Traders
Whether you are a new or an experienced trader, DailyFX has several resources available to help you; indicator for tracking trader sentiment, quarterly trading forecasts, analytical and educational webinars held daily, and trading guides to help you improve trading performance.
We also have a series of guides for those looking to trade specific markets, such as the S&P 500, Dow, DAX, gold, silver, crude oil, and copper.
---Written by Paul Robinson, Market Analyst
You can follow Paul on Twitter at @PaulRobinsonFX


