


Crude oil still has room to sell-off before arriving at meaningful support, shorting bounces preferred. Gold has been tough to get a good handle on, but has a couple of meaningful levels to watch which could make things easier if broken. The S&P 500 is positioned higher but has a wedge coming into view which could bring a solid move just down the road.
Technical Highlights:
- Crude oil (US & UK) has room to go on the downside
- Gold could soon offer traders a discernable trend
- S&P 500 bias upward, building wedge could lead to nice move soon
For in-depth fundamental and technical analysis for your favorite market or currency, check out the DailyFX Forecasts.
Crude oil (US & UK) has room to go on the downside
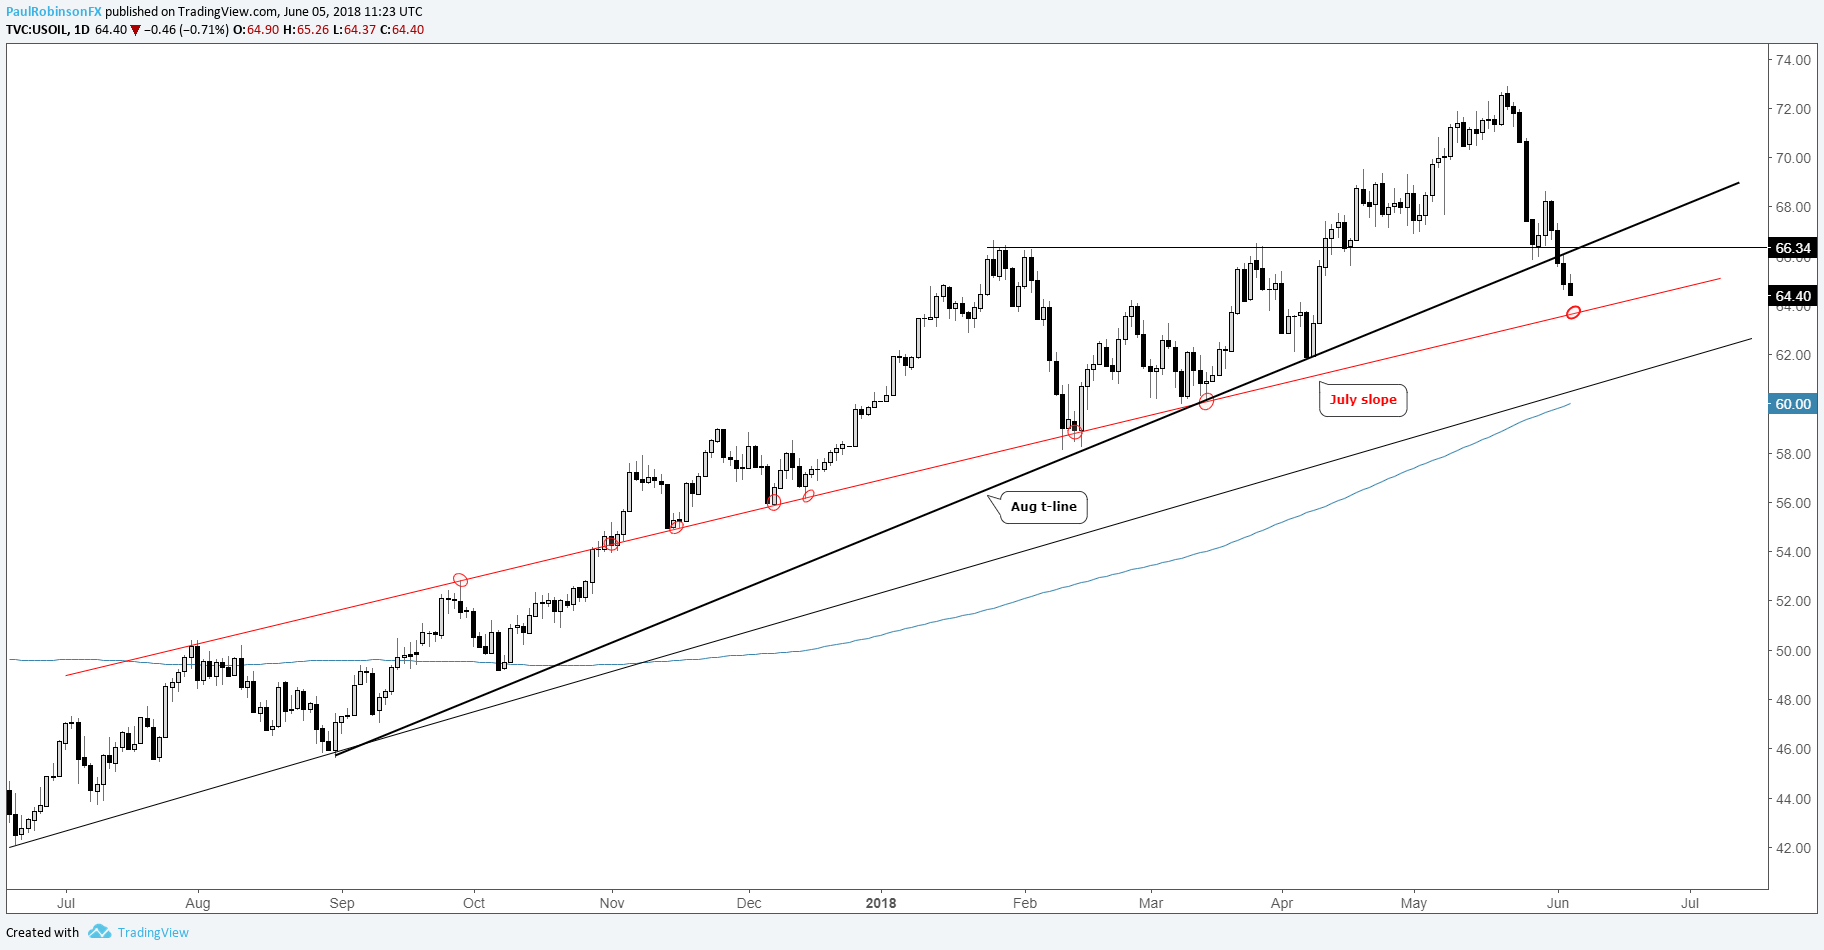
US crude oil, as we discussed as a possibility last week, changed character when it failed to put in a quick low at support as it has over the past year. The break below the August trend-line has momentum rolling downhill towards the July slope. It’s a very important slope given how many times it has had an influence since last summer.
For now, there is a little room to go on the downside until the slope is touched, making short-term rallies likely to fail until then. A bounce to around 66 would make for the best spot in my view to short, but given the overall weakness that may be difficult to obtain. How oil plays out upon a test of the July slope could be quite telling for the intermediate-term.
US Crude Oil Daily Chart
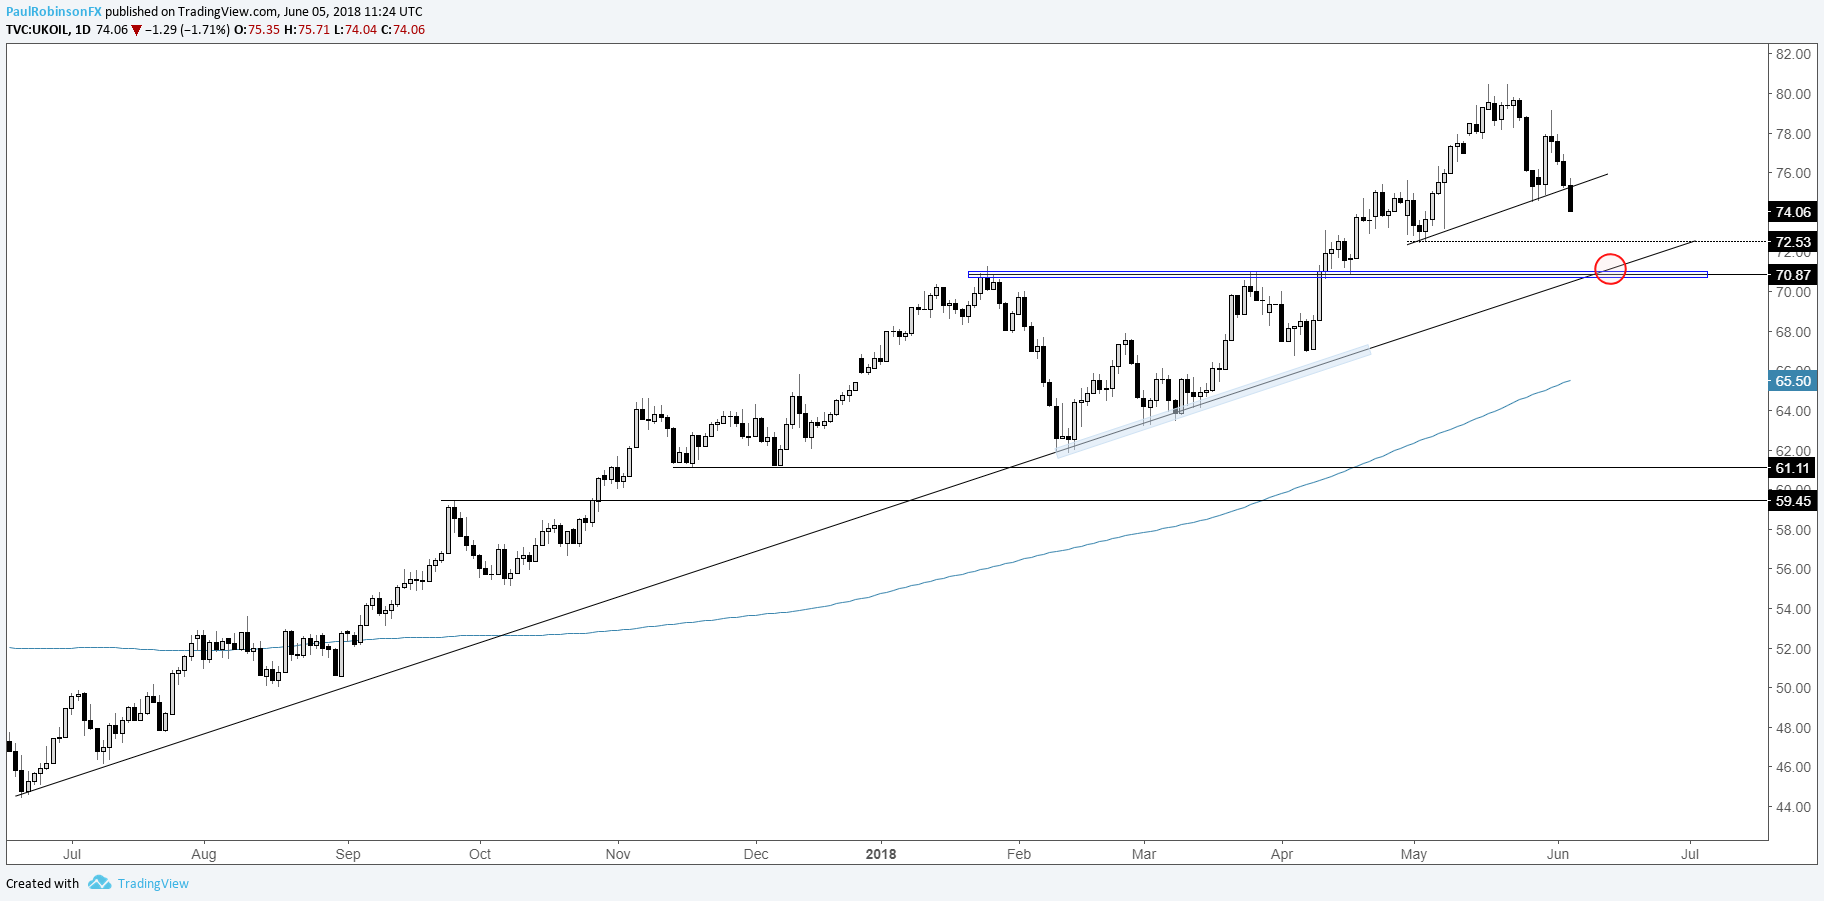
UK crude oil is working on a lower-low from the very tail-end of last month, with meaningful support on further weakness arriving around 72.50. Brent’s equivalent line to the July slope in the US contract is the June trend-line just under 71, where also lies a pair of peaks from earlier the year. Brent might not get a solid bounce until that point is met.
UK Crude Oil Daily Chart
For the intermediate-term fundamental/technical outlook, check out the Crude Oil Forecast
Gold could soon offer traders a discernable trend
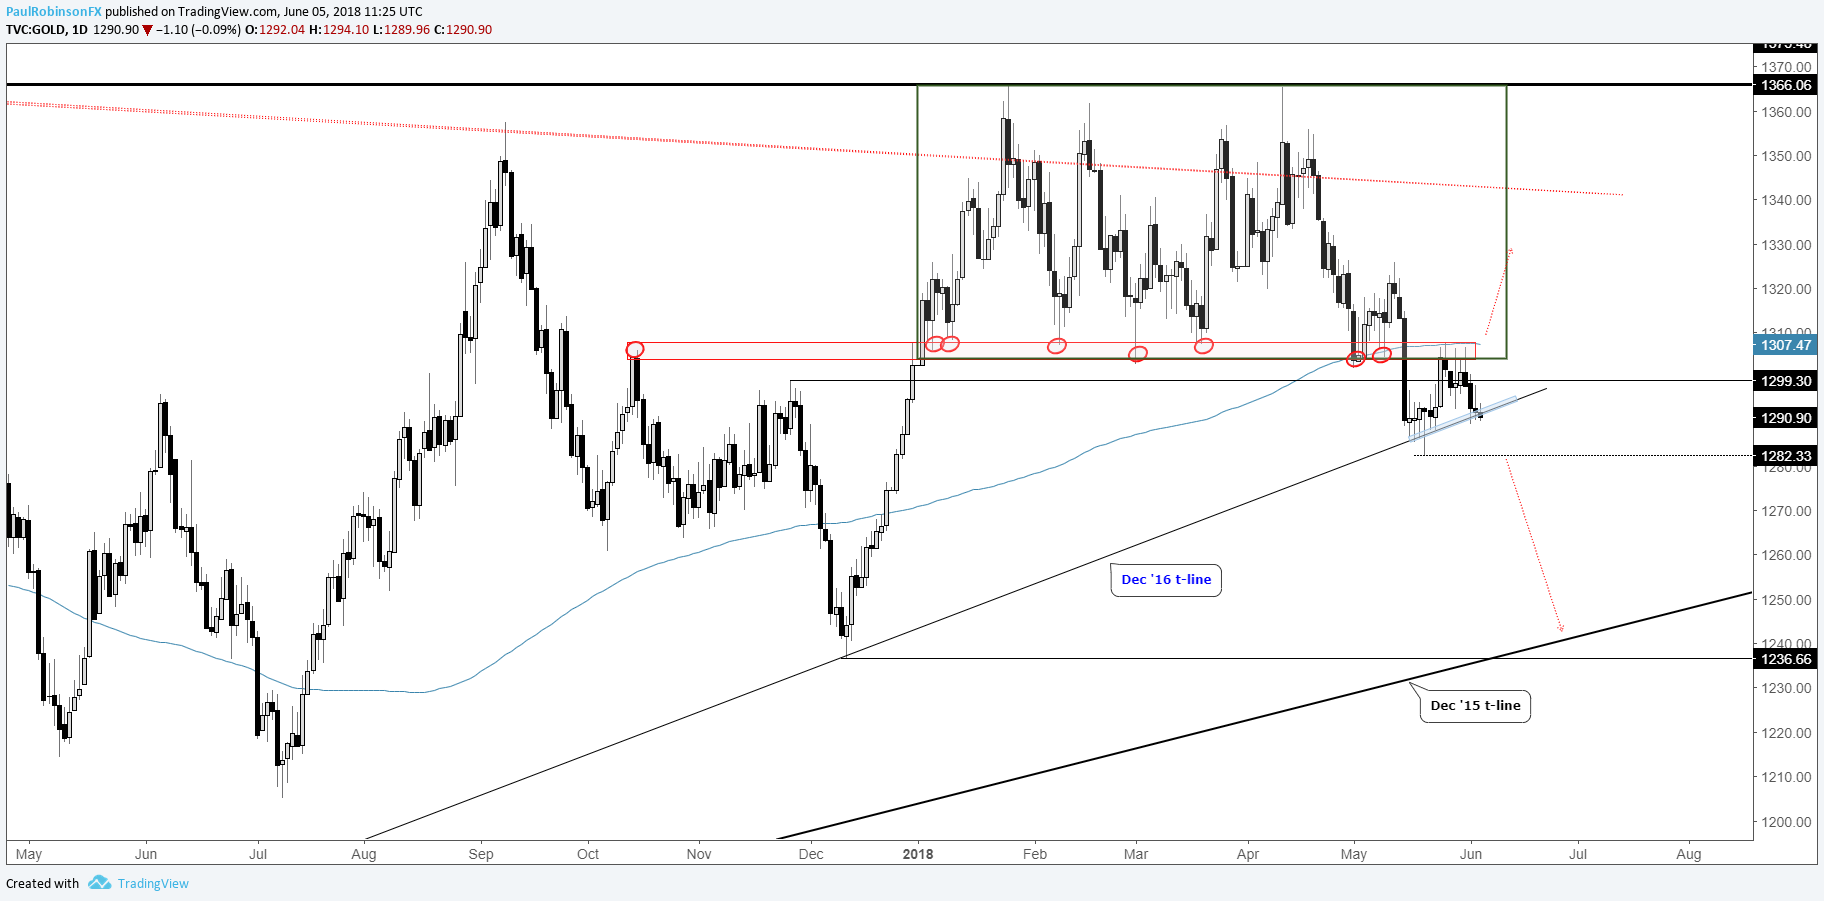
Gold is teetering on the December 2016 trend-line after a series of rejections recently at the bottom of the multi-month range which started at the beginning of the year. A break of the trend-line and 1282 low could finally bring a solid one-way trade in gold, with no real support arriving until around 1240/36.
A sustained break back inside the range could bring in top-side momentum, but given all the price congestion from the prior months, it looks to be the tougher path to trade.
Gold Daily Chart (Bottom of range/Trend-line)
For the intermediate-term fundamental/technical outlook, check out the Gold Forecast
S&P 500 bias upward, building wedge could lead to clean move soon
The S&P 500 continues to have an upward bias, furthered along with yesterday’s breakout above 2742. The next level of price resistance isn’t until around the 2800-threshold, but there is the possibility an ascending wedge forms, in which case the top-side trend-line about 20 points higher might be a problem.
The tightening up of a wedge formation, which would ultimately lead to poorer short-term trading conditions, appears to be the best scenario for setting traders up with a strong move later on. Should it reach maturity, a break to the bottom-side could mark the 3rd peak of a developing top since January, while a breakout to the top-side would likely lead to a test if not better of the old record highs. For now, tentatively bullish with the wedge-scenario on the table.
S&P 500 Daily Chart (Wedge building)

For the intermediate-term fundamental/technical outlook, check out the Global Equity Indices Forecast
Resources for Index & Commodity Traders
Whether you are a new or an experienced trader, DailyFX has several resources available to help you; indicator for tracking trader sentiment, quarterly trading forecasts, analytical and educational webinars held daily, trading guides to help you improve trading performance, and one specifically for those who are new to forex.
---Written by Paul Robinson, Market Analyst
You can follow Paul on Twitter at @PaulRobinsonFX


