


EUR/USD continues to fall down the rabbit hole with other major currencies at the mercy of USD strength. GBP generally vulnerable, not just against the dollar. Gold finally snapped 1300, has trend-line test up next.
Technical Highlights:
- USD strength, EUR/USD set up to test support levels
- GBP-pairs generally vulnerable
- Gold price finally snaps range, t-line test next
For in-depth fundamental and technical analysis for your favorite market or currency, check out the DailyFX Q2 Forecasts.
USD strength, EUR/USD set up to test support levels
The US Dollar Index (DXY) has room to go before running into resistance around the 94-line, where there are several inflection points as resistance dating back to August. Beyond there the next level clocks in around 95. A small pullback to the trend-line off last month’s low could offer another attractive entry for fresh longs. A hold of trend support would also create another higher-low to work with.
DXY Daily Chart (Looking for ~94 next)

For the intermediate-term fundamental/technical outlook, check out the Q2 Forecast for the USD
The bounce in the euro was brief and with Monday’s bearish key-reversal bar momentum was shifted firmly back lower. The similar level to the 94-line in the DXY, is around 11700. The zone surrounding it could provide a bounce, but not viewed as so much of a buying opportunity for longs, but rather a spot for shorts to look to as a possible spot to book profits. Below the 11700-area the November 11554 level arrives as support.
EUR/USD Daily Chart (Support levels below)

For the intermediate-term fundamental/technical outlook, check out the Q2 Forecast for the EUR
GBP-pairs generally vulnerable
GBP/USD has been virtually lifeless the past couple of weeks despite the precipitous plunge from near 14400. Looking lower, the next area of meaningful support clocks in around 13300, and below there nothing of substance until near 13000. We could see another head-fake higher (it is cable, after all), but will be viewed as a seller’s opportunity.
GBP/USD Daily Chart

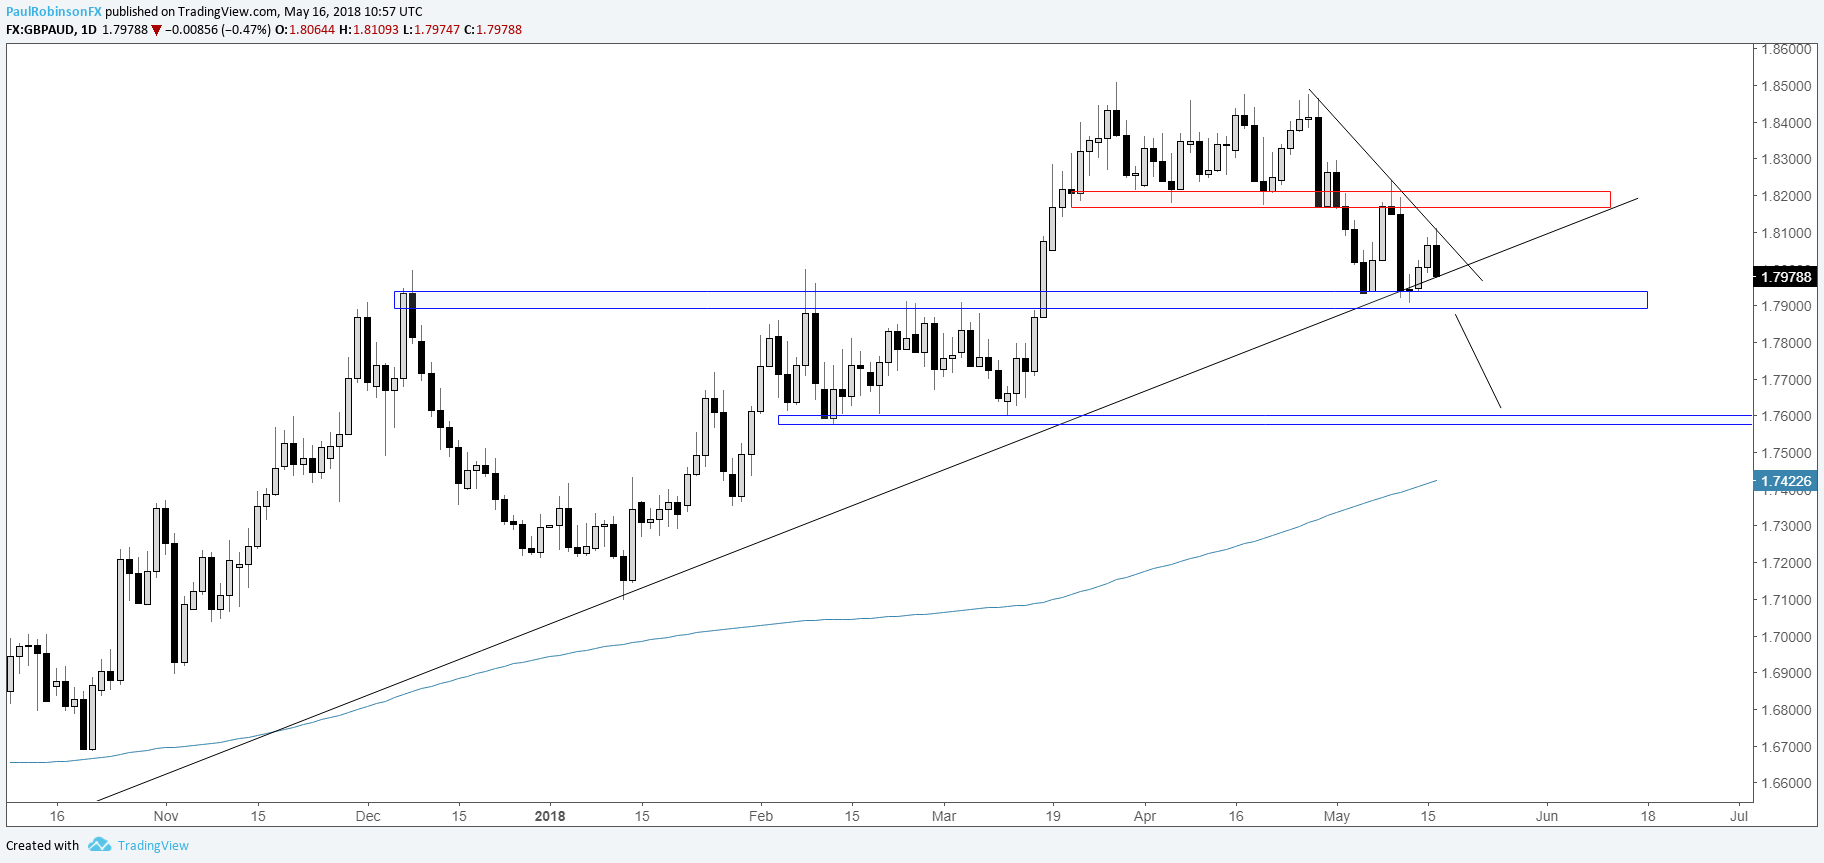
GBP/AUD recently bounced off a trend-line dating back to August, but has generally been weakening over the past couple of weeks. A break below the trend-line and horizontal support just under 17900 will have eyes on support around the 17600-threshold. (We also looked at GBP/CAD, GBP/JPY, and GBP/NZD.)
GBP/AUD Daily Chart (Support at risk of breaking)
For the intermediate-term fundamental/technical outlook, check out the Q2 Forecast for GBP
Gold price finally snaps range, t-line test next
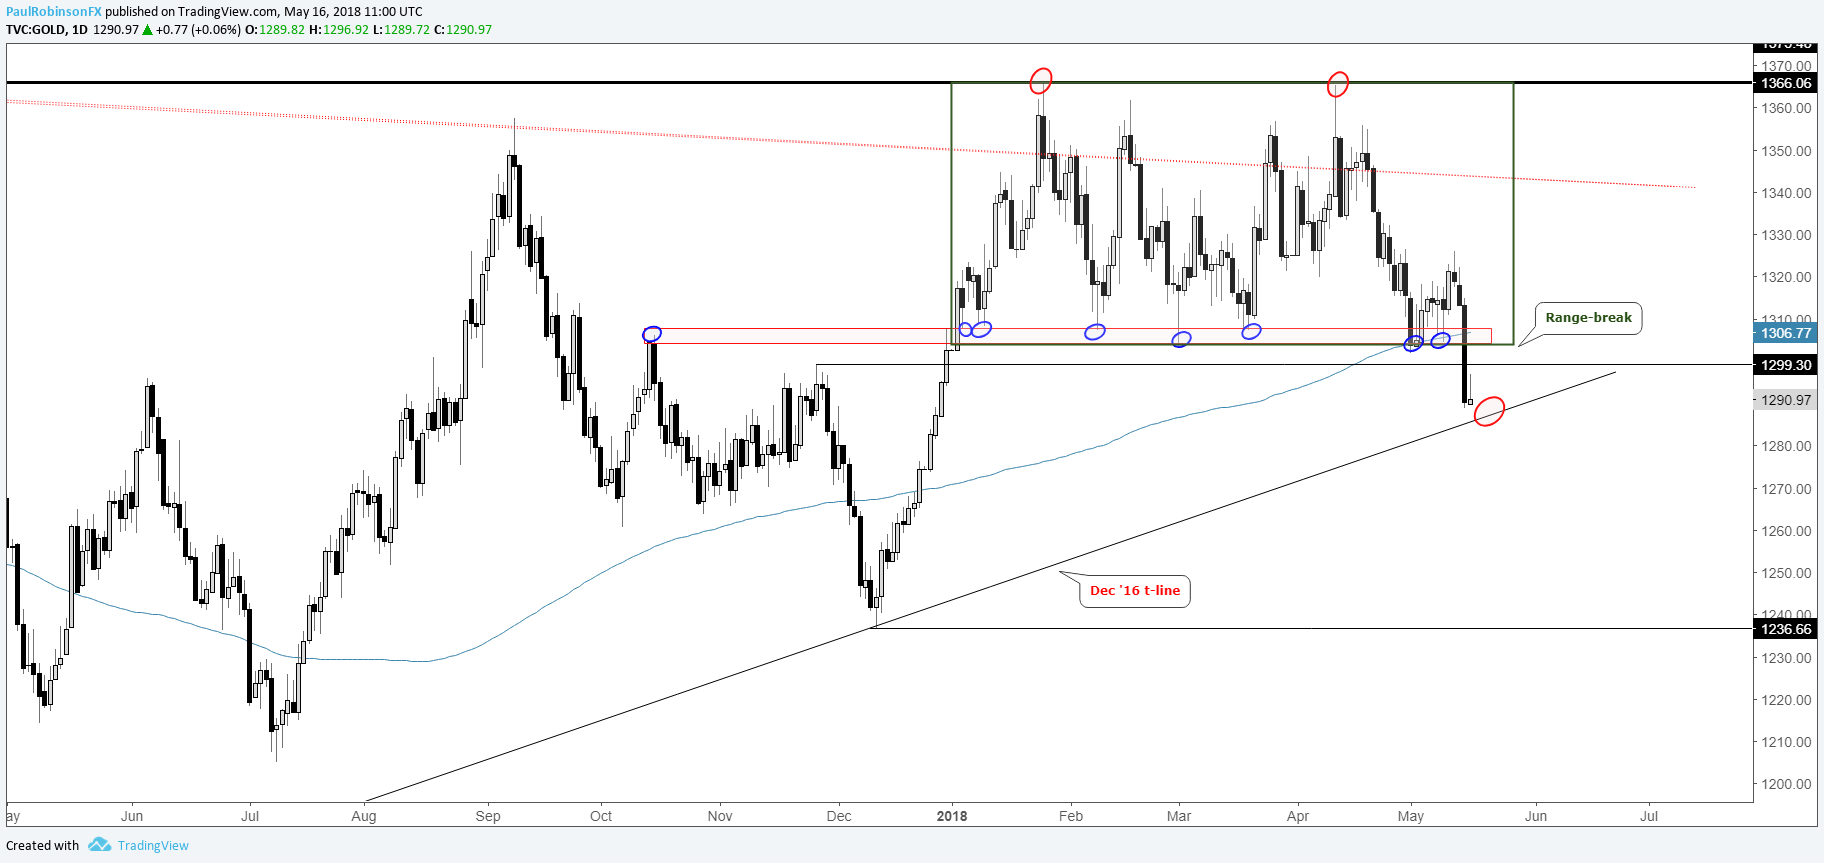
Gold was hammered yesterday thanks to USD strength. Weakness looks set to continue now that the range dating back to the very beginning of the year has finally been snapped. There is trend-line support rising up from December 2016, but the range-break is viewed as more important and suggests trend support won’t hold. The December/January rally looks at risk of becoming erased on a move down to the 1230s.
Gold Daily Chart (Range-break, Trend-line next)
For the intermediate-term fundamental/technical outlook, check out the Q2 Forecast for Gold
Resources for Forex & CFD Traders
Whether you are a new or an experienced trader, DailyFX has several resources available to help you; indicator for tracking trader sentiment, quarterly trading forecasts, analytical and educational webinars held daily, trading guides to help you improve trading performance, and one specifically for those who are new to forex.
---Written by Paul Robinson, Market Analyst
You can follow Paul on Twitter at @PaulRobinsonFX


