


Gold price is threatening to break the bottom of the range dating back towards the beginning of the year. Crude oil is generally bullish with one potentially bearish scenario. The DAX is getting help from the euro, firmer risk appetite, while the S&P 500 tries to sneak higher.
Technical Highlights:
- Gold at risk of breaking 1300
- Crude remains bullish, with bearish alternate
- DAX and S&P 500 outlook is tentatively bullish
For in-depth fundamental and technical analysis for your favorite market or currency, check out the recently released DailyFX Q2 Forecasts.
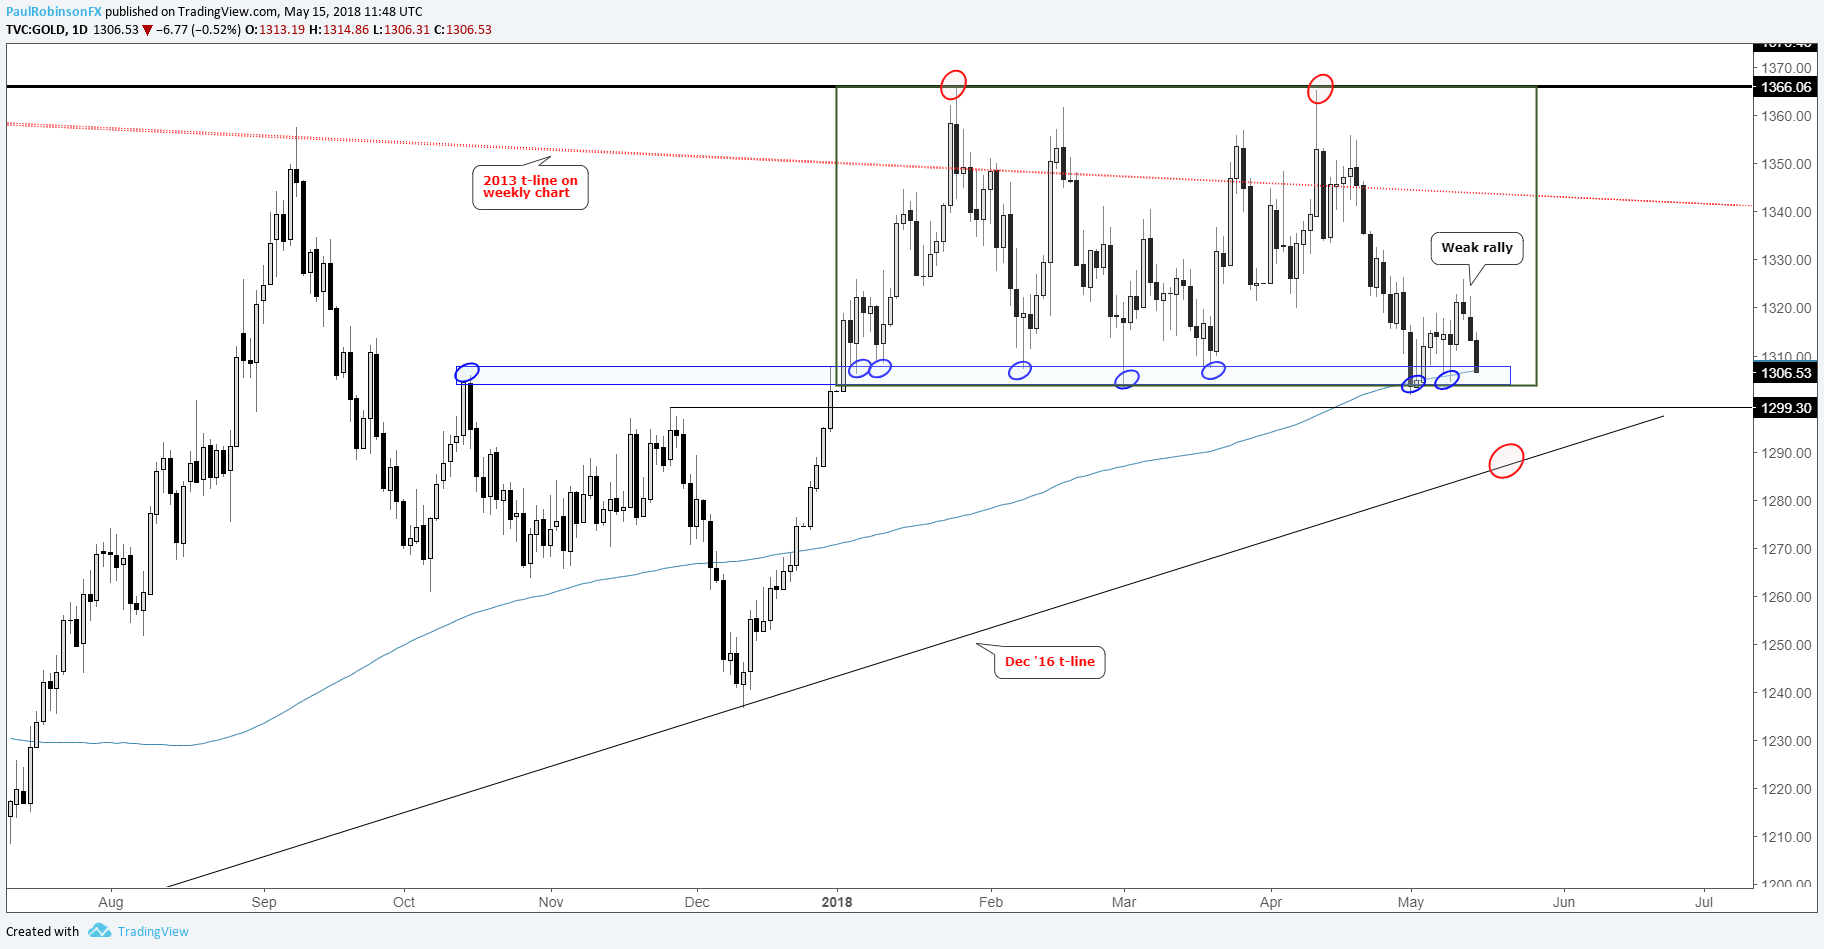
Gold at risk of breaking 1300
Last week, gold posted a pair of bullish rejection bars right around 1305 and the 200-day MA; it was further confirmation that the area just above 1300 is extremely important. Failure to maintain a rally so far despite those rejections is also telling us that this extremely important area of support might not last for much longer.
Since the early-part of this year we have seen strong surges from support, but now we are not seeing the same kind of buying interest. Of course, we didn’t have a surging dollar like we do now (which is the likely and the obvious culprit), but nevertheless price action in gold is weakening.
A move through 1300 looks near, and should we see a daily close below support then the next targeted line of support arrives via the December 2016 trend-line.
Gold Daily Chart (Risk of range-break looms)
For the intermediate-term fundamental/technical outlook, check out the Q2 Forecast for Gold
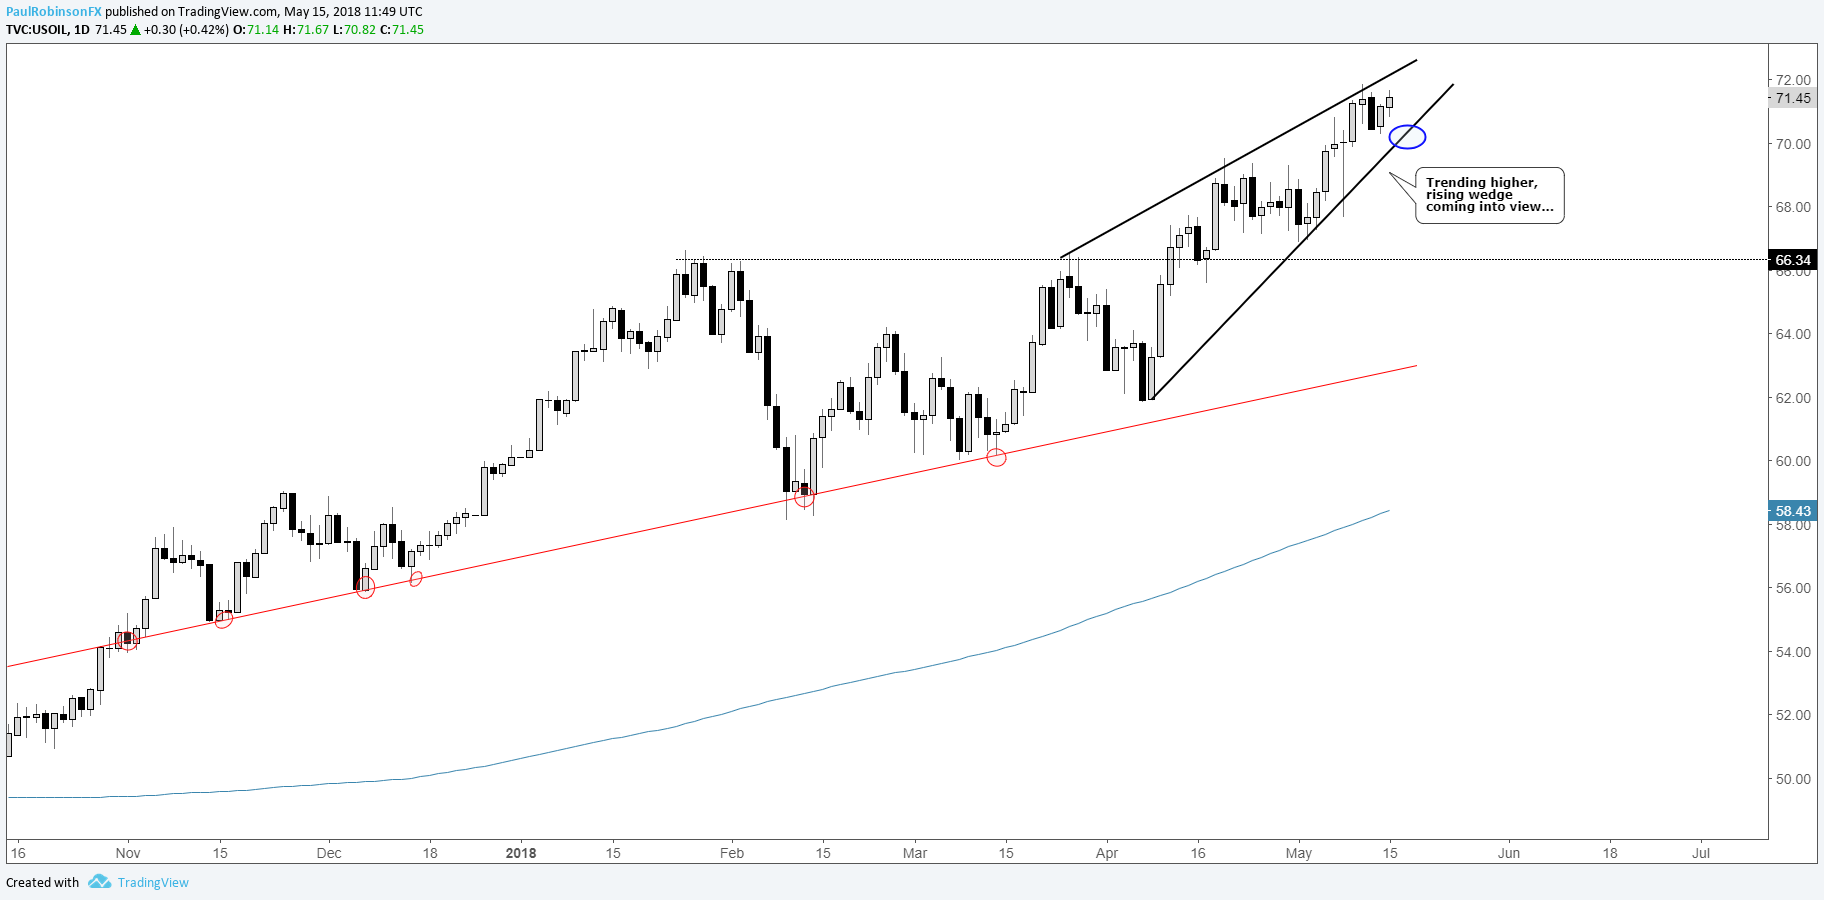
Crude remains bullish, with bearish alternate
There is no denying that the trend in crude oil is higher on several time-frames, and on that our interest is in trading along the path of least resistance. However, there is one potentially bearish alternate scenario; price action is funneling into a rising wedge.
The wedge could very well lead to a shot higher, though, and with the trend strong it’s a risk to the bearish alternate. For the pattern to imply lower prices, a break of the lower trend-line (now viewed as buyer’s support) is needed first. For now, rolling with the top-side until price action indicates otherwise.
We touched a little on what could mark the end of the strong up-move – powerful squeeze higher, a capitulation by the market to join the trend. The wedge could in fact lead to such an outcome, but this is only a possibility for now. We’ll take a reactionary stance should such a move develop.
US Oil Daily Chart (Tilted higher, Rising wedge forming)
For the intermediate-term fundamental/technical outlook, check out the Q2 Forecast for Crude Oil
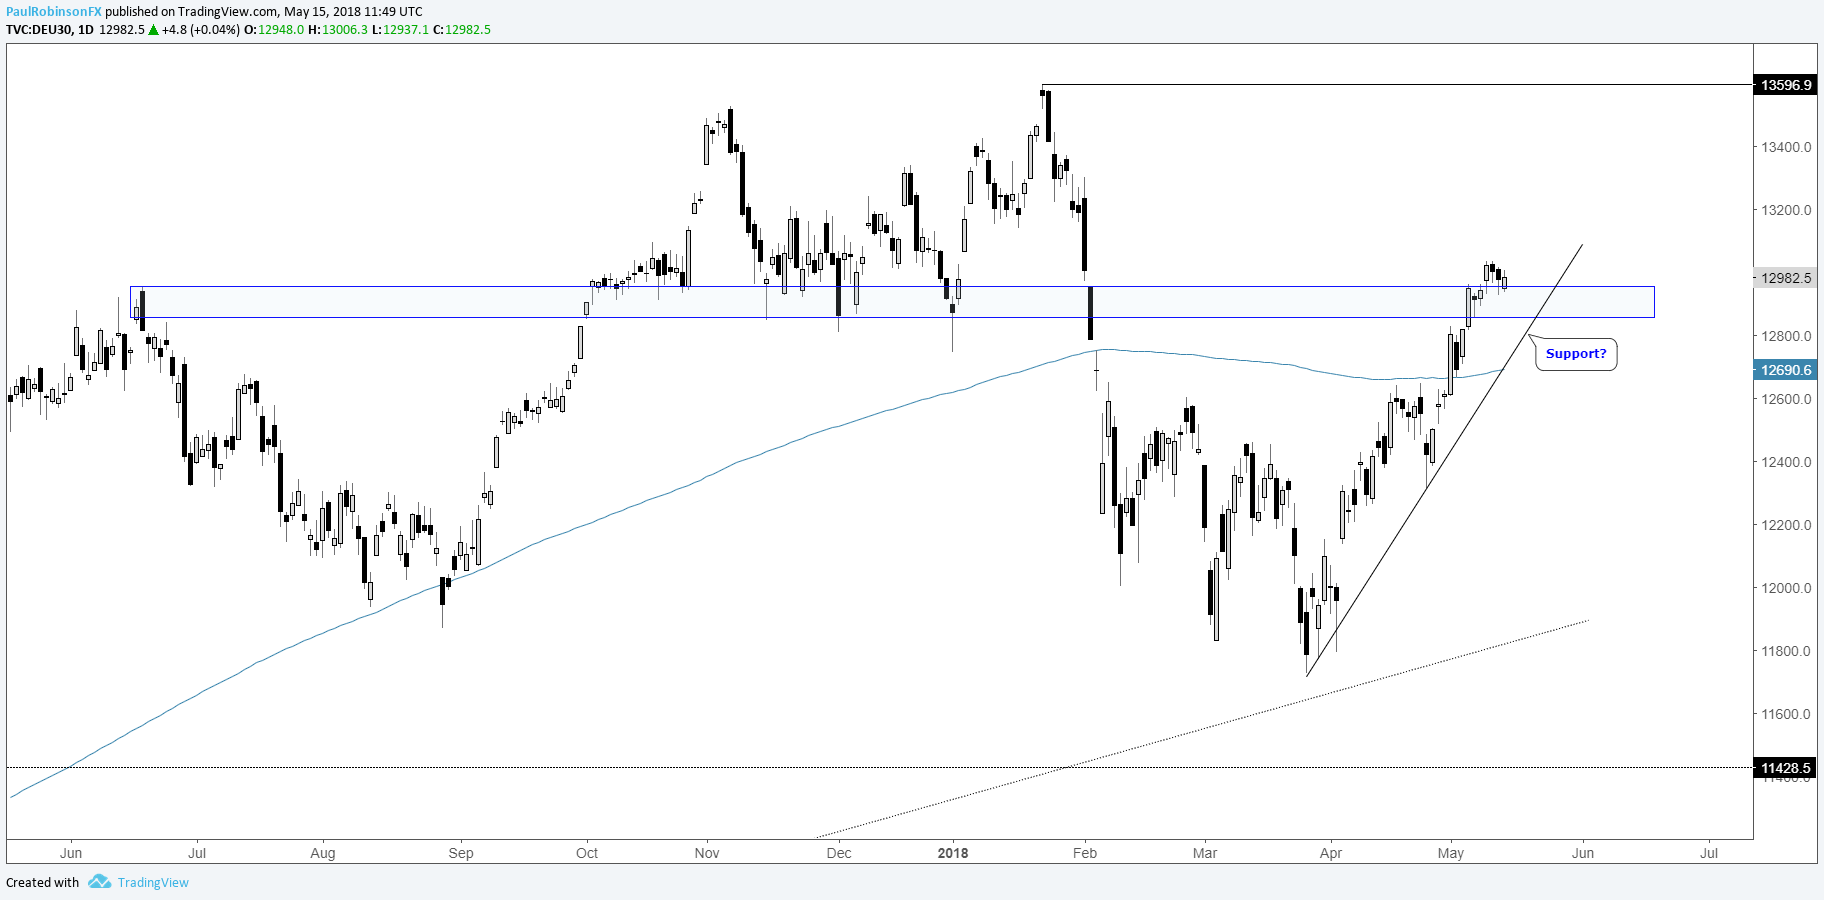
DAX and S&P 500 outlook is tentatively bullish
The DAX is a bit of a tough handle at the moment with it having run to extended lengths and not having tested its trend just yet. The euro is a boon for the Euro-zone indices, something which we discussed not from so much a directional standpoint, but from the viewpoint of risk management. See this morning’s DAX/CAC commentary for more details.
DAX Daily Chart
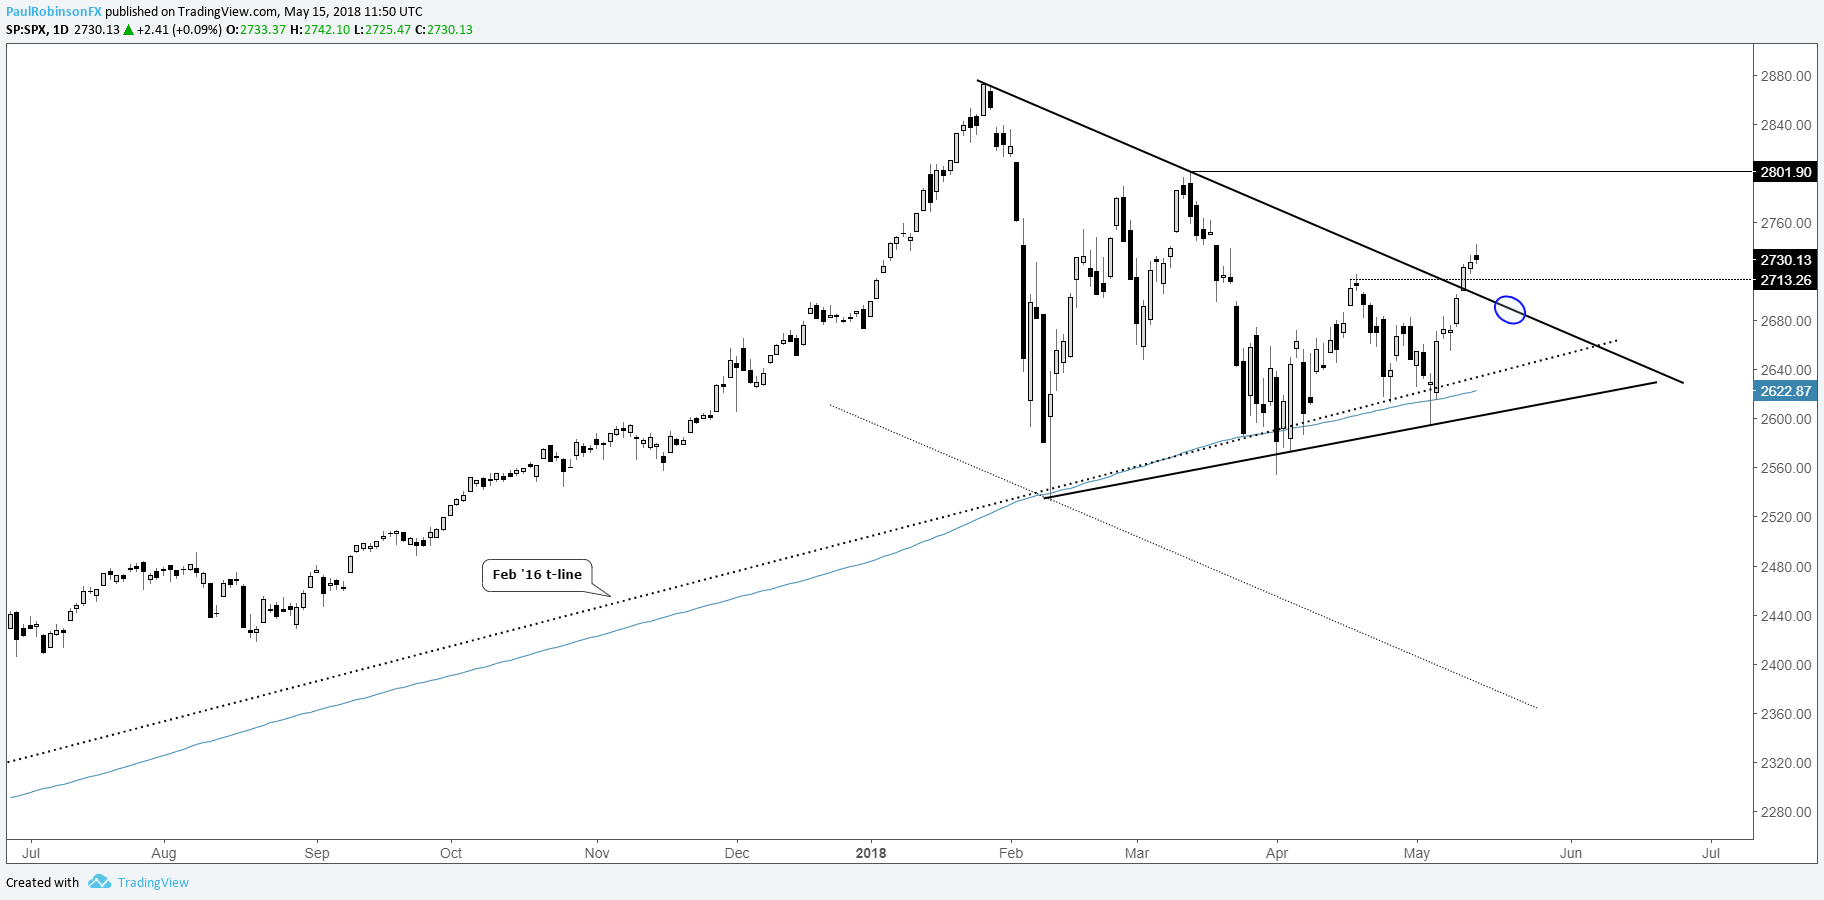
The S&P 500 snuck above the trend-line off the highs, triggering a loosely constructed triangle pattern. This has the market pointed higher, but trust in the drive higher is minimal at this point. A drop, test, and hold of the recently broken trend-line would add weight to it as support and boost confidence in higher prices. For now, in a holding pattern until better clarity.
S&P 500 Daily Chart
For the intermediate-term fundamental/technical outlook, check out the Q2 Forecast for Global Equity Indices
Resources for Index & Commodity Traders
Whether you are a new or an experienced trader, DailyFX has several resources available to help you; indicator for tracking trader sentiment, quarterly trading forecasts, analytical and educational webinars held daily, trading guides to help you improve trading performance, and one specifically for those who are new to forex.
---Written by Paul Robinson, Market Analyst
You can follow Paul on Twitter at @PaulRobinsonFX


