


In this webinar, we used price action to look at macro markets as we near the end of the first quarter of 2018. Last week’s rate hike out of the Federal Reserve produced some equity weakness that is continuing to show, even after yesterday’s aggressively bullish rally. And the US Dollar remains in a bearish state, even after the earlier morning rip that saw prices move up to catch resistance at prior support. As usual, we retained balance around the US Dollar, looking into setups on both sides of the Greenback, as we discuss below.
Talking Points:
- If you’re looking to improve your trading approach, our Traits of Successful Traders research could help. This is based on research derived from actual results from real traders, and this is available to any trader completely free-of-charge.
- If you’re looking for a primer on the FX market, we can help. To get a ground-up explanation behind the Forex market, please click here to access our New to FX Trading Guide.
If you’d like to sign up for our webinars, we host an hour-long event on Tuesday and Thursday, each of which can be accessed from the below links:
Tuesday: Tuesday, 1PM ET
Thursday: Thursday 1PM ET
To receive James Stanley’s Analysis directly via email, please sign up here.
S&P Rally – Bulls Shy Away at Resistance
We started by looking at what appears to be a big area in the S&P 500 around 2660-2666, as there are a number of Fibonacci retracements in this zone of prices. During the webinar, prices scaled-down to a fresh session low, indicating that the selling pressure that’s been showing with a bit more prominence in the equity space of recent does not yet appear to be done. The bigger question, at least on a longer-term basis, is what happens at the 2530 double bottom from early –February? If we do see a higher low here on a failed test, the bullish side remains attractive. But – if February support can’t hold, look out below.
US Dollar Rallies Up to Range Support
That persistent weakness in the US Dollar continued into Monday, as another downside run pushed prices down to the 89.00 level on DXY. This gave the appearance of bearish continuation in a longer-term bearish trend; but as we warned, be careful of getting caught in a trap – with this being both month and quarter-end, peculiar things can happen. And in a trend that’s been as strong and directional as the Greenback has been, this could equate to a very sharp rally very quickly as we near the end of this week. This started to show earlier this morning, right around the European open. Price action in USD made a quick leap into prior range support, at which point sellers came back. Nonetheless, we continued to impose a balanced stance around the Greenback, looking at the most opportunistic ways of taking on exposure on either side of the currency.
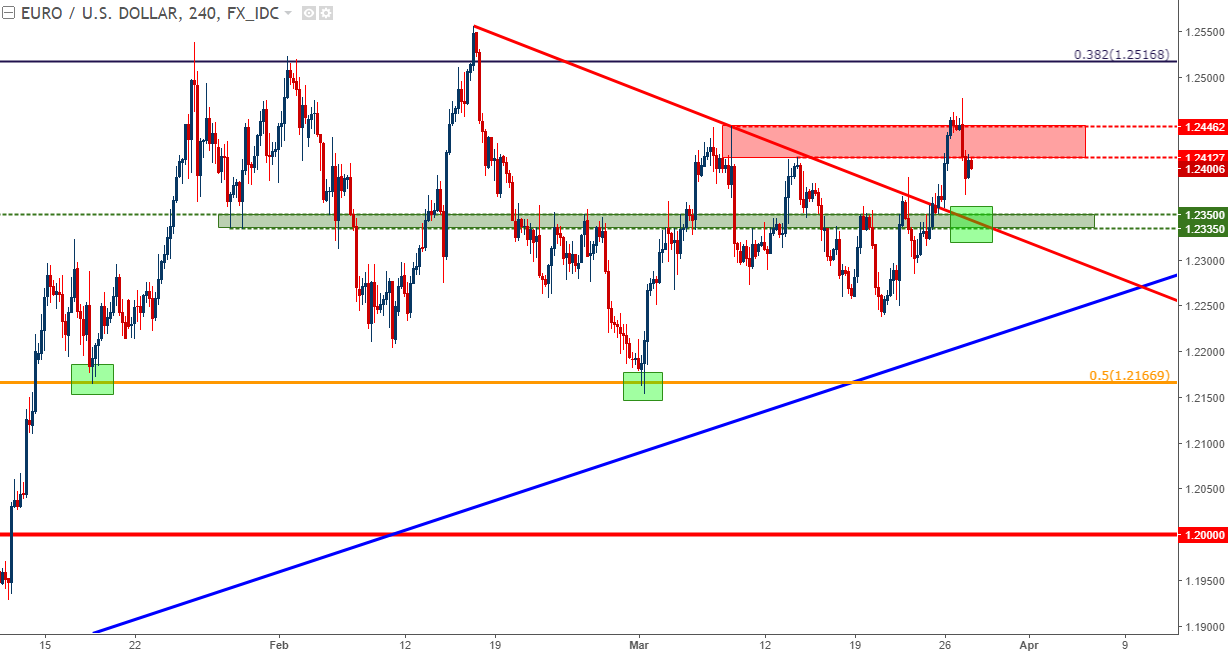
EUR/USD In Resistance Zone – Prior Bearish Trend-line as Fresh Support?
One of the more attractive short-USD scenarios is that EUR/USD trend from 2017. Last week saw a bullish break of a bearish trend-line that showed-up off the January and February highs in the pair, and yesterday we looked at a batch of resistance taken from a batch of prior highs. At this point, today’s candlestick body is right in the middle of that resistance, which doesn’t make for much that’s usable at the moment. It can, however, help to highlight a more attractive area of support around that same region that we’ve been following that runs from 1.2335-1.2350, which also happens to line up with the projection of that bearish trend-line that was broken last week. Will old resistance show up as fresh support?
EUR/USD Four-Hour Chart: Confluent Support Potential Around 1.2335-1.2350
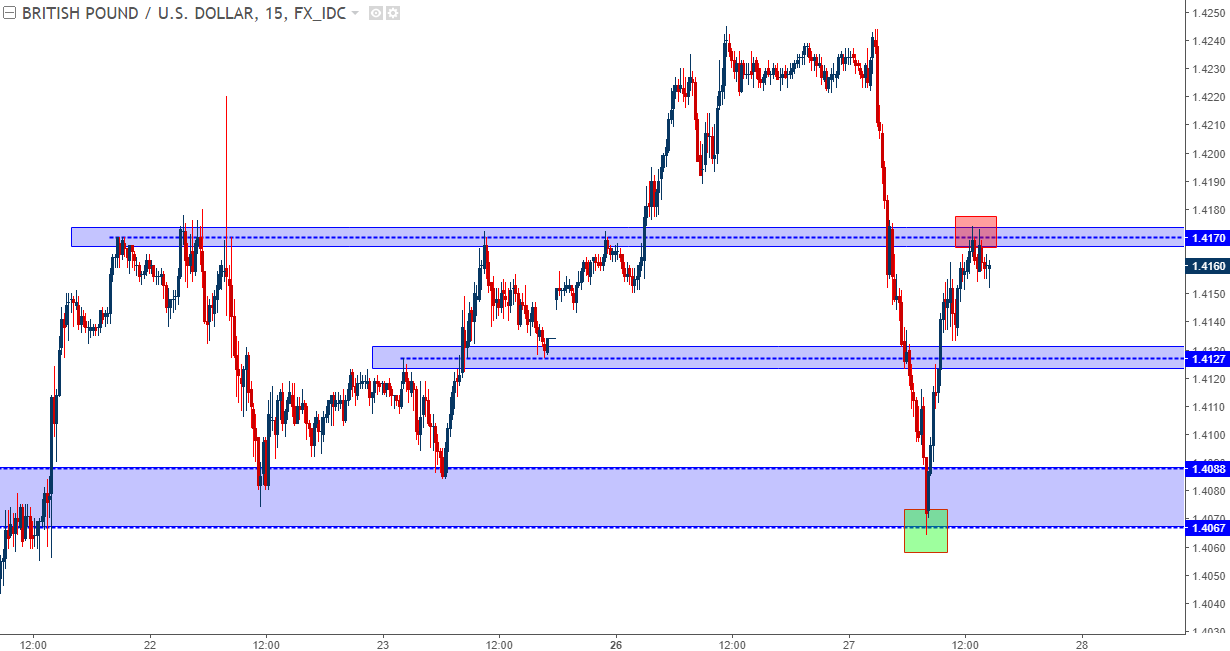
GBP/USD – Aggressive Pullback After Bullish Breakout
This has been a wild ride of recent. We looked at a bullish set off of the 1.4000 psychological level last week, and then we looked at three levels of support yesterday. After what was a rather climactic ride, the third of those support levels helped to catch this morning’s low, and prices have now moved up to resist at the ‘s1’ of those levels. This makes the prospect of bullish continuation a bit more complicated, but a pullback to the ‘s2’ level that we looked at around 1.4127 can keep the door open for topside setups.
GBP/USD 15-Minute Chart: S3 Support, S1 Resistance
USD/CAD
The Canadian Dollar was one of the weaker currencies in the world during February and March; and so far in 2018, CAD weakness has far outpaced the US Dollar. But, since USDCAD topped out last Monday, the pair has continued to retrace. The past four days have seen a bit of support develop around 1.2825, but this feels trappy. We looked at what could be a more attractive support area from 1.2725-1.2750. Other than that, we’re going to need some element of short-term strength to show before there’s enough evidence to act on this well-worn support.
USD/JPY
This is the one many are following, as we saw a break of a big zone of longer-term support last week. We looked at a couple of different ways of looking at short-side exposure, and the area that seems to be widely-followed is in the 106.00-106.60 region. As I shared, when so many are looking for the same thing and it seems too clean to be true, it often is; so we looked at a couple of different ways of handling the short side of USD/JPY moving forward.
AUD/USD – Look for a Deeper Retracement
Price action has run into support over the past week and even with instances of USD-strength, such as we saw this morning, that support has held up. We moved down to shorter-term charts to focus-in on the higher-lows that have shown, and this appears to indicate a deeper corrective move may be on the horizon. We simply cast expectations for resistance a bit deeper, to that same zone we were looking at last month around the .7850 level.
NZD/USD
This may be a bit more actionable than AUD/USD, at least if considering long-USD scenarios. The longer-term area of resistance here is at .7335, as taken from the 38.2% retracement of the Fibonacci retracement around the 2009-2011 major move in the pair. We plotted a shorter-term bearish trend-line to help assist with timing into the setup.
USD/CHF Bears Appear to Be Back
Last week when we looked at this pair, the setup could cut in both ways. Since then, we’ve had a bearish trend-line come into play, a return below .9500 and the initial stages of lower-lows showing on shorter-term charts. All of these factors can highlight the short-side of the setup, looking for a bearish push towards the prior two-year low around .9257 and then the fresh two-year low of .9184.
Gold
We looked at Gold prices yesterday, and Gold is rubbing up against the resistance side of a channel taken from the 2016-2017 highs. We looked at two inside support levels, around 1335 and 1326 that could be usable for bullish approaches.
To read more:
Are you looking for longer-term analysis on Gold prices? Our DailyFX Forecasts for Q1 have a section specifically for Gold. We also offer a plethora of resources on our Gold page, and traders can stay up with near-term positioning via our IG Client Sentiment Indicator.
Forex Trading Resources
DailyFX offers a plethora of tools, indicators and resources to help traders. For those looking for trading ideas, our IG Client Sentiment shows the positioning of retail traders with actual live trades and positions. Our trading guides bring our DailyFX Quarterly Forecasts and our Top Trading Opportunities; and our real-time news feed has intra-day interactions from the DailyFX team. And if you’re looking for real-time analysis, our DailyFX Webinars offer numerous sessions each week in which you can see how and why we’re looking at what we’re looking at.
If you’re looking for educational information, our New to FX guide is there to help new(er) traders while our Traits of Successful Traders research is built to help sharpen the skill set by focusing on risk and trade management.
--- Written by James Stanley, Strategist for DailyFX.com
To receive James Stanley’s analysis directly via email, please SIGN UP HERE
Contact and follow James on Twitter: @JStanleyFX


