


Talking Points:
- Gold prices had shown struggle since setting a fresh high in late January, with long-term resistance coming-in from an area comprised of both the 2016 and 2017 swing-highs. After last week’s leap in Gold prices, resistance is again showing around this zone, confluent with a descending trend-line taken from the lower-highs in 2018.
- The big question is whether this long-term resistance may yield to surging prices, as a continuation of weakness in the US Dollar has helped to lift many commodities back towards multi-year highs. Below, we look at the prospect of using shorter-term charts for bullish continuation scenarios in Gold.
- Are you looking to improve your trading approach? Check out Traits of Successful Traders. And if you’re looking for an introductory primer to the Forex market, check out our New to FX Guide.
Do you want to see how retail traders are currently positioned around Gold? Click here for IG Client Sentiment.
Gold Prices Pose Round-Trip From Support to Resistance Around FOMC
Just last week Gold prices were testing support, which happened to come-in around the 2015 high of $1,307.59. This wasn’t the first test of that level as support, as instances in February and earlier in March both led to bullish responses. But, as those bullish reactions were growing weaker, as indicated by lower-highs on shorter-term charts, the premise of bullish continuation was becoming less likely, or at the very least less attractive. But, as that support was able to hold into Wednesday, a fresh run of US Dollar weakness in the wake of the FOMC rate hike helped to push Gold prices back-up to resistance.
As we move towards the end of Q1, Gold prices are testing a big area of resistance. Prices are currently running up against the descending trend-line that can be found by connecting the January and February swing highs; both of which reside within a zone of resistance between the prices of $1375.15 and $1357.50. These prices were the 2016 and 2017 swing highs in Gold, respectively, and at this stage they remain as longer-term resistance.
Gold Price Chart, Daily Time Frame: Resistance Zone at 2016, 2017 Highs
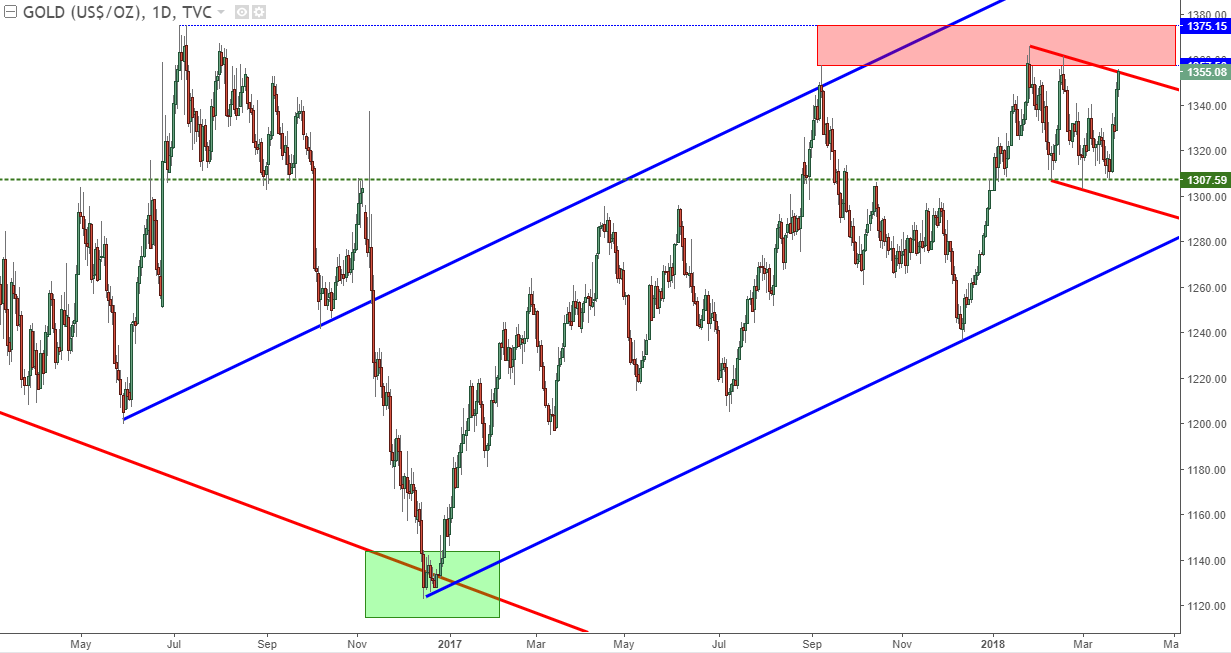
Chart prepared by James Stanley
Bulls Take Control, But Can They Take Out $1,375?
This area has twice turned-around advances in 2018, and as we re-approach this area on the chart, Gold bulls will likely want to heed caution in case another reversal comes about.
Last week’s strength in Gold prices to go along with another instance of USD weakness produced a strong bullish breakout beyond the short-term trend-line we were looking at last week. As the move continued on Thursday and Friday, a series of higher-lows showed-up at familiar areas with both the $1,325 area and the $1,344 area helping to cauterize higher-lows as the bullish run continued.
Gold Hourly Chart: Higher-Highs, Lows After Last Week’s Short-Term Breakout

Chart prepared by James Stanley
Moving Forward
At this stage, the pair remains in a bullish spot on both a short and intermediate-term basis. The sole remaining short-side thesis at this point would be looking for a longer-term bearish reversal as this bigger-picture area of resistance begins to get tested again.
For traders looking at bullish continuation with the expectation that prices will pose a deeper test within this resistance zone or, perhaps even lead into a bullish breakout to fresh three-year highs; the prospect of higher-low support remains. The price of $1,335 could be especially attractive for such a scenario should it come into play, as this was a level of resistance that hasn’t yet shown much for support since last week’s breakout.
For those that want to be a bit more aggressive with the matter, potential higher-low support at the areas around $1,344 and the much closer $1,350 could be interesting for such a play.
Gold Price Chart, Hourly Time-Frame: Higher-Low Support Potential

Chart prepared by James Stanley
To read more:
Are you looking for longer-term analysis on Gold prices? Our DailyFX Forecasts for Q1 have a section specifically for Gold. We also offer a plethora of resources on our Gold page, and traders can stay up with near-term positioning via our IG Client Sentiment Indicator.
Forex Trading Resources
DailyFX offers a plethora of tools, indicators and resources to help traders. For those looking for trading ideas, our IG Client Sentiment shows the positioning of retail traders with actual live trades and positions. Our trading guides bring our DailyFX Quarterly Forecasts and our Top Trading Opportunities; and our real-time news feed has intra-day interactions from the DailyFX team. And if you’re looking for real-time analysis, our DailyFX Webinars offer numerous sessions each week in which you can see how and why we’re looking at what we’re looking at.
If you’re looking for educational information, our New to FX guide is there to help new(er) traders while our Traits of Successful Traders research is built to help sharpen the skill set by focusing on risk and trade management.
--- Written by James Stanley, Strategist for DailyFX.com
To receive James Stanley’s analysis directly via email, please SIGN UP HERE
Contact and follow James on Twitter: @JStanleyFX


