


Talking Points:
•The S&P 500 posted its biggest bullish gap on the daily - and weekly open in nearly a decade Monday
•Gaps occur primarily due to liquidity - though gaps in continuous and discrete markets carry very different connotation
•A strong bullish gap for US equities is impressive but it doesn't resolve what is left in general volatility
How do you trade in current market conditions? What fundamental themes are most important to follow? Are there hidden risks in popular assets? Bring your trade, market and strategy questions to Tuesday's Trading Q&A. Sign up on the DailyFX Webinar Calendar.
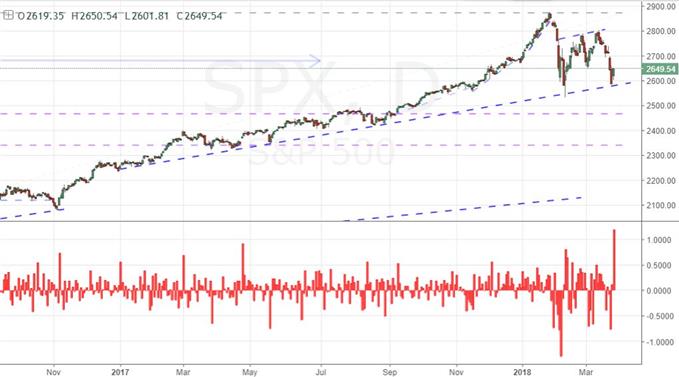
A Remarkable S&P 500 Jump to Start the Week
Following last week's painful dive - the worst performance over such a period in two years - a bounce doesn't come as too great a surprise. Yet, the intensity of rebound from the S&P 500 is nevertheless remarkable. Monday's 2.7 percent rally for the benchmark US index is the largest single-day charge in two-and-a-half years. Perhaps even more impressive is the gap that started the session and week off. Gaps are a common site in shares and indices, but an open 1.2 percent higher than Friday's close is extraordinary. This was the largest such bullish leap in nearly a decade - specifically back to November 21, 2008 when it was rumored that Timothy Geithner would be elected Treasury secretary. The few surges of this level of bullish intensity on an open over the past decades occurred notably at the trough of mature and intense bear trends. Does this remarkable technical milestone signal a similar outcome for the S&P 500? To make that qualification, we should consider the aspects that foster such gaps.
The Importance of Liquidity in Markets and Gaps
Gaps in general arise from a lack of liquidity. This can be a planned gap in market interest or one that arises from difficult conditions. Most gaps occur between the close of one session and the open of the next. Markets that trade on exchanges will have business hours which come to a close out of necessity. Though prices may not update and trades officially clear in these assets, there are inevitably developments during the off-hours. Trying to deal near where the previous session closed when a seismic event or data occurs after hours would be foolish. In so-called continuous markets where there is 24 hour (or close to it) trading, there are still gaps typically over the weekend. While FX trades even over the weekends, the market is nevertheless thin.
Gaps In Liquid and Active Markets
Naturally illiquid markets - those with little underlying trading - will naturally have bigger jumps between prices even in the height of the trading session. The greater the liquidity behind a market, the more infrequent gaps during active hours become. However, such events do occur. A decade ago, the NFPs release was an occasion where benchmark equity indices and even Dollar-based FX pairs could experience strong jumps before the market would meet orders again. Monetary policy events are another source of impressive jumps - particularly the Swiss National Bank's (SNB) sudden reversal on its accommodative push back in January 2015. Though it seems continuous on a chart, there was most certainly an extreme gap for EUR/CHF measured in thousands of pips. The implications between a session-derived gap and unexpected liquidity loss is vast. The former happens due to the evolution of fundamental value change just without the market to facilitate it. The latter occurs due to a severe change in conditions that systemically unnerves the market and its pricing capabilities.
What Conditions Present for the S&P 500
Differentiating the types of gaps that we come across, it is clear that what we are dealing with is the more common session interval. The intensity of the move is still remarkable, and clearly motivated by a strong fundamental swing. It isn't difficult to identify the drive behind the market rebound. Following two weeks of heavy selling, the markets were stretched in the short-term even as a tangible theme arose (the rise of trade wars) to take the reins. With high-profile support in sight and the speculative rank reticent to capitulate on years of building exposure, there was a natural sensitivity to headlines which would provide relief from the headwinds. Reports that parties from the US and China were negotiating trade offers an acceptable foothold for a natural bounce. Yet, the timing and circumstance of this technical move do not present a strong backdrop for conviction to the revival of a mature bull trend. This seemsvery much a volatility meeting volatility situation with dubious follow through conditions. We discuss gaps and the S&P 500's particular circumstances in today's Quick Take Video.
To receive John’s analysis directly via email, please SIGN UP HERE


