


The US Dollar Index (DXY) is breaking down, with support levels from 2009-2010 coming into view. EUR/USD is consolidating gains following the recent breakout, looking higher. AUD/USD near a big resistance zone. Precious metals have key levels capping the up-move.
Technical Highlights:
- US Dollar Index (DXY) breakdown looks poised to continue
- EUR/USD constructively digesting recent gains
- Trading outlook for AUD/USD, NZD/USD & other USD-pairs
- Gold & silver benefiting from weak dollar, but have resistance
For longer-term technical and fundamental analysis, and to view DailyFX analysts’ top trading ideas for 2018, check out the DailyFX Trading Guides page.
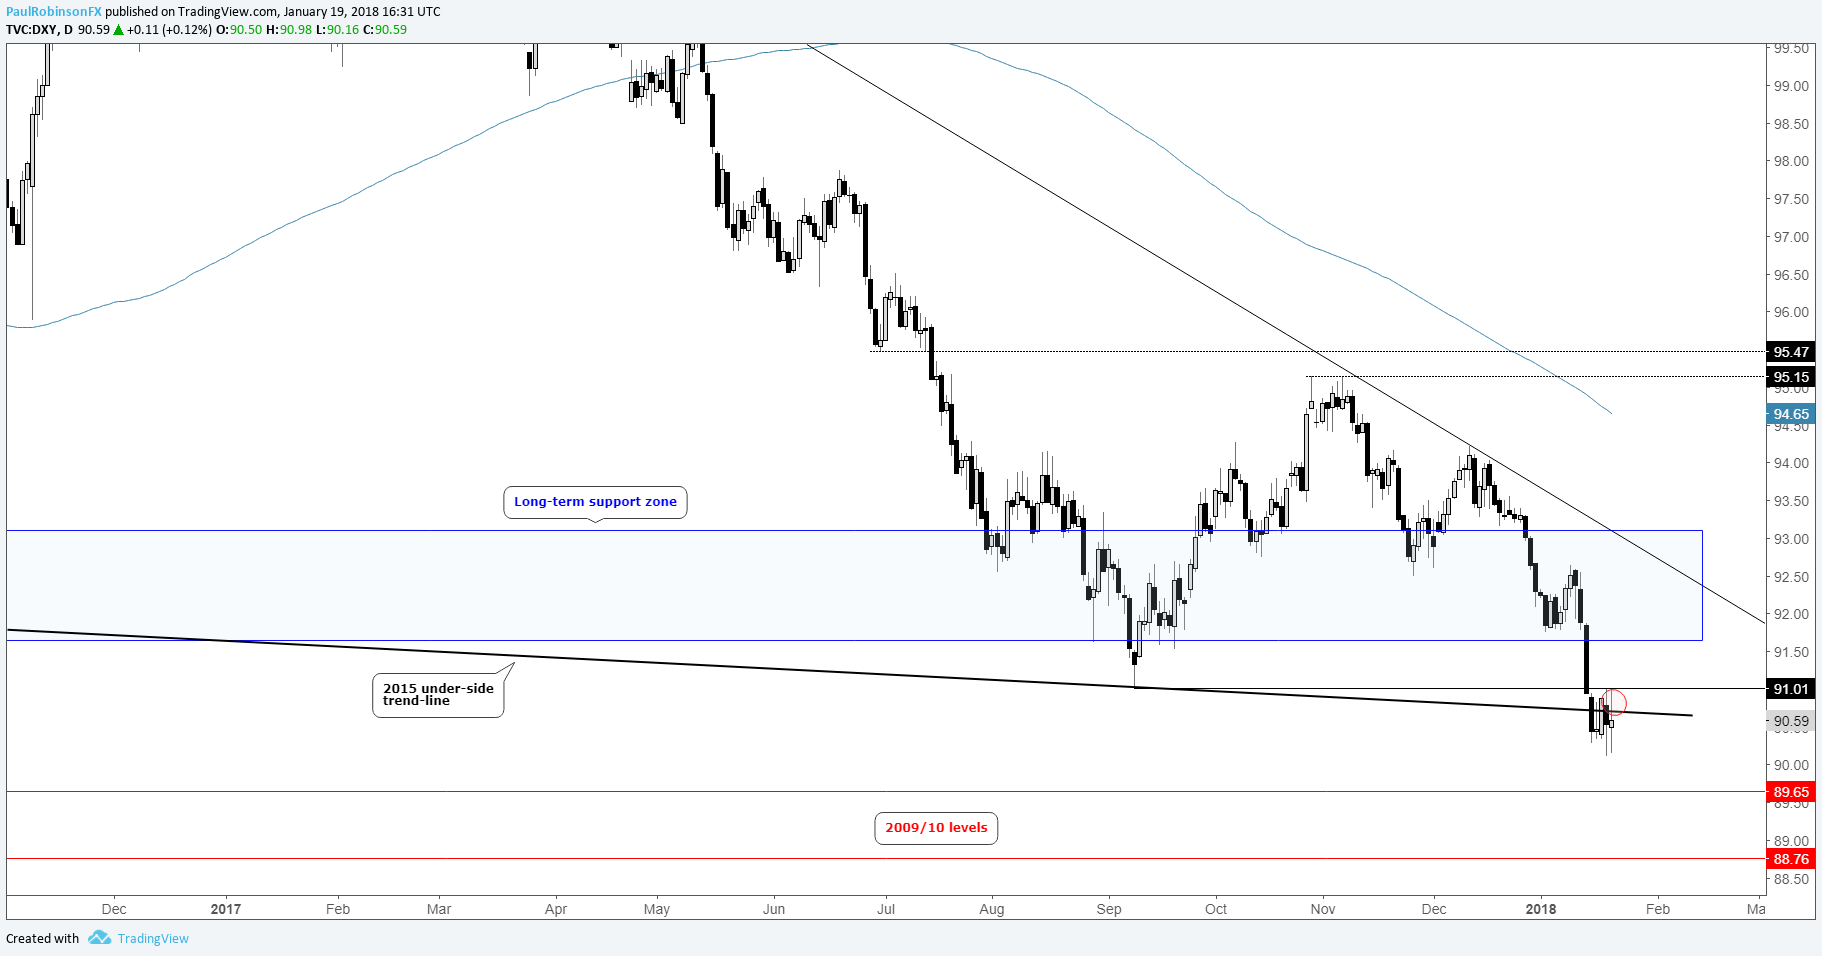
DXY looking for new support, EUR/USD consolidating
The US Dollar Index (DXY) is trading below a support zone extending all the way back to 1998, and is currently trading just beneath an underside trend-line extending back to 2015. Though below these big thresholds, there are peaks from 2009/10 at 8965 and 8876 which could provide support on another leg lower. But with there still room to go until these levels are met, the trading bias remains bearish.
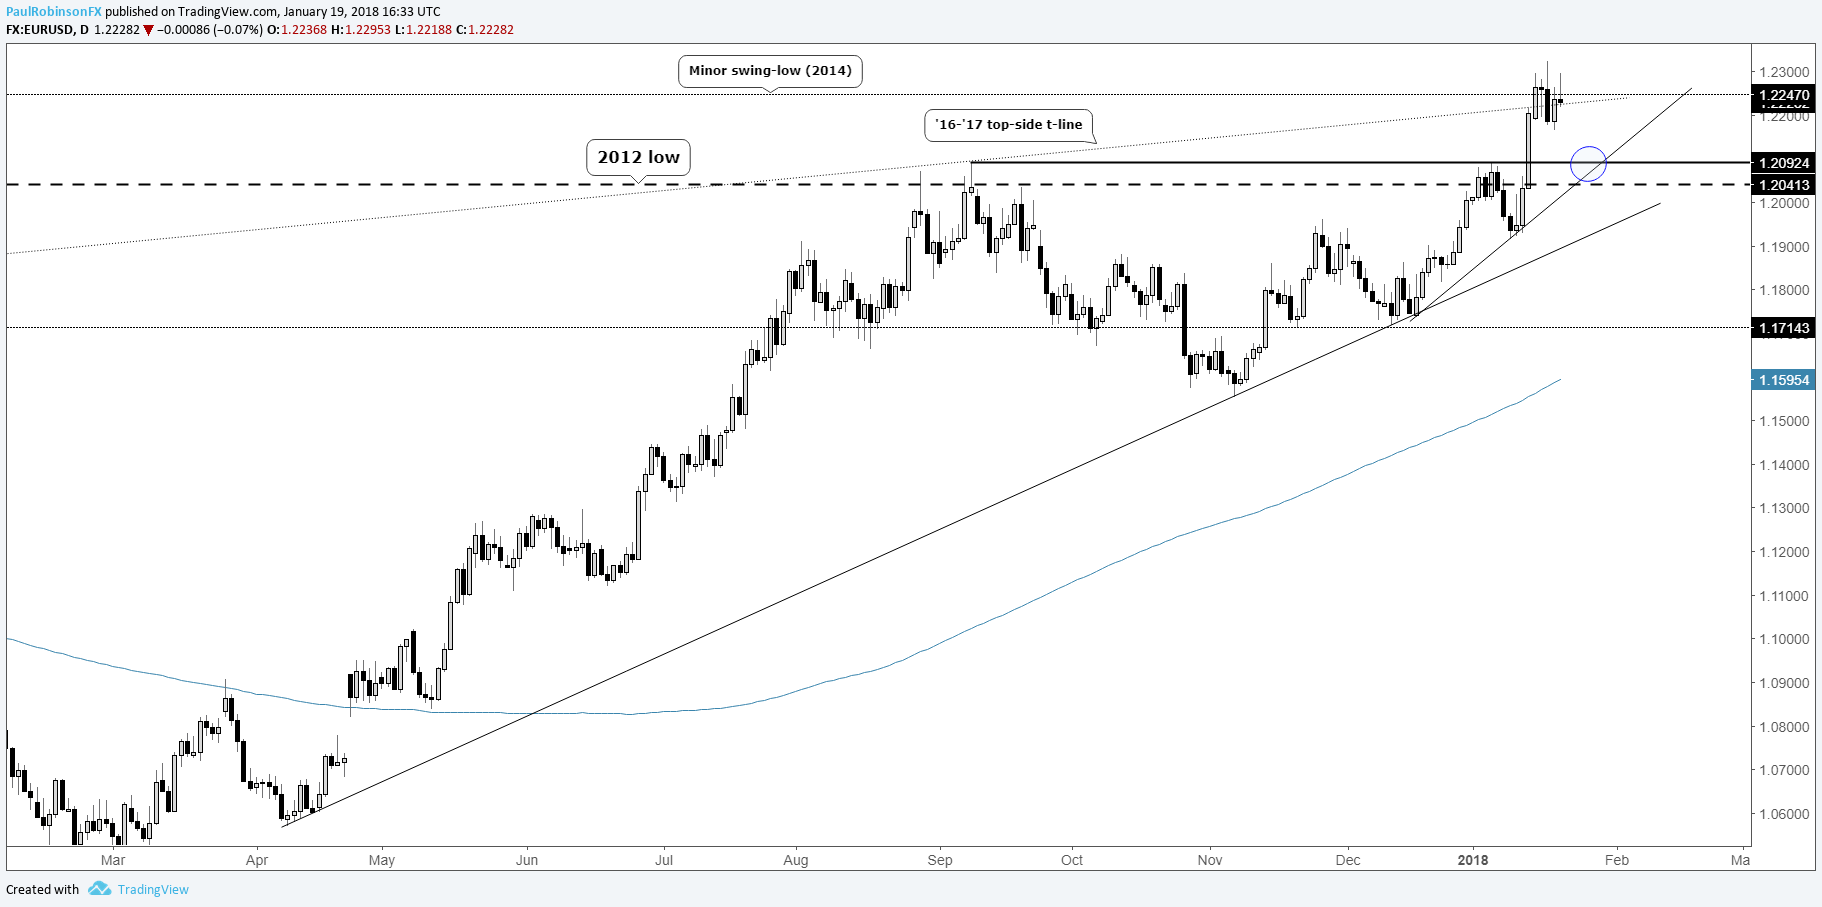
With the euro as ~57% of the DXY, it is of course a big driving factor for the index. EUR/USD is consolidating after the recent breakout, and looks poised to continue higher after a little more 'backing-and-filling'. The bigger-picture target is the 2008 trend-line close to 12600.
Chart 1 – US Dollar Index (DXY): Daily
Struggling with confidence? You’re not alone. Check out this guide, Building Confidence in Trading.
Chart 2 – EUR/USD: Daily
AUD/USD, NZD/USD closing in on big resistance
On Wednesday, we discussed AUD/USD and NZD/USD as they are on approach of key resistance zones. AUD/USD actually traded right into the bottom of the zone this morning and is weakening from it. Soon we may see a material pullback set in as it has rallied from December in one fell swoop and has become overbought.
Chart 3 – AUD/USD: Daily

NZD/USD hasn’t rallied quite as aggressively recently, and still has room to go before reaching into the resistance zone penciled in from around 7340 up to around 7400. That zone has not only good price levels going back to late-2016, but also a trend-line from the 2014 high.
We also looked at USD/JPY, which is sitting on a trend-line back to September 2016. If it were to give-way along with 11019, focus will turn towards 10885 and 10813 (2012 t-line lies in the vicinity of the latter price level). USD/CAD, USD/MXN, USD/ZAR were also examined as part of the weak dollar-spectrum.
Gold & silver contained by resistance
Precious metals continue to hang out beneath resistance, with the impact of a weak dollar diminishing in recent trade. Gold has a steadfast trend-line from 2013 to contend with, while silver has even stronger price resistance and a trend-line dating back to the July spike-high.
It’s only a scenario at the moment, but with a little more time on the current bounce, silver could carve out a head-and-shoulders. It may or may not develop, but it would certainly be a tantalizing spot to have an H&S form given the proximity of resistance. An update will be provided on Tuesday in the webinar focused on indices & commodities.
Chart 4 –Silver: Daily

Trading Resources
Whether you are a new or experienced trader, we have several resources available to help you; indicator for tracking trader sentiment, quarterly trading forecasts, analytical and educational webinars held daily, trading guides to help you improve performance, and a guide specifically for those who are new to forex.
---Written by Paul Robinson, Market Analyst
To receive Paul’s analysis directly via email – SIGN UP HERE
You can follow Paul on Twitter at @PaulRobinsonFX


