
Talking Points:
- Participation has strong ties to volume or volatility, but they are not strictly related aspects to the system
- Positioning data like the COT and DailyFX Sentiment data can give important context to net exposure data
- Open interest in equity index (S&P 500 emini) futures have leveled out; but hit records for the Euro, VIX and Treasuries
What are some of the biggest mistakes traders make, and how can you adapt for them? Download our Traits of Successful Traders trading guide.
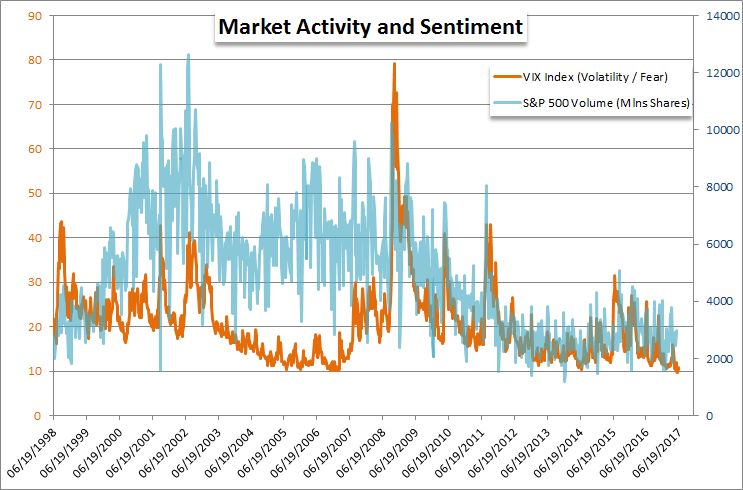
Traders spend a considerable amount of analysis time plotting out their forecasts for activity (volatility) and turnover (volume) - and for good reason. These are important characteristics for evaluating what kind of market we are dealing with. However, another critical facet to understanding the financial and trading landscape is assessing participation. The number of traders in the market can tell us much more about the circumstances behind a jolt of activity, conviction behind an existing drive or the seeming start of a new trend.
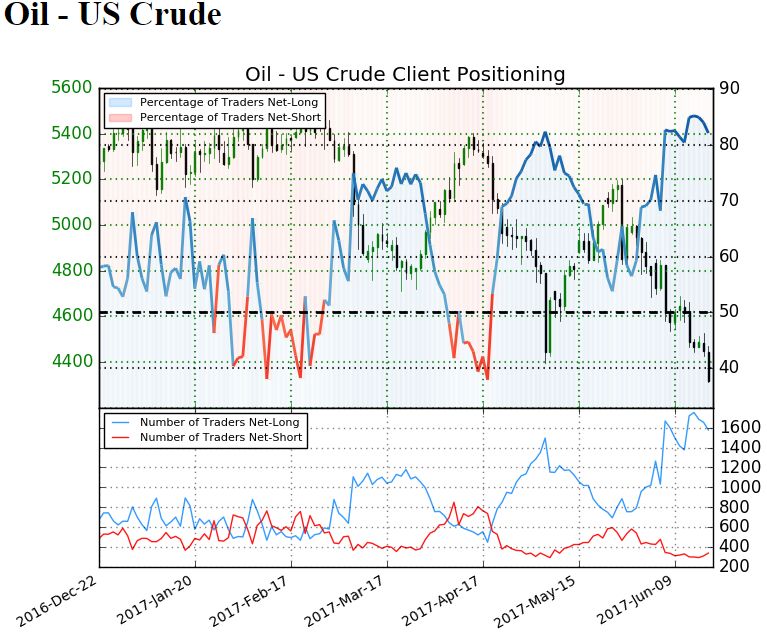
There are different ways to measure participation and none of them are perfect. Asset specific measures like the DailyFX Positioning data (for spot FX and CFDS) and the exchange-based futures figures at least offer measureable baselines. We focus in on the latter for breadth and range of historical data. Volume is certainly available on this market, but the open interest figures (total number of open positions) and net positioning among different participant types - speculative, commercial and hedge - offer a more comprehensive view of the market behind prevailing price. The Commitment of Traders report, more often referred to as the COT, can offer a for speculative-centric view of the markets. Speculative futures traders for example have pushed their net long EUR/USD position to a six year high and have pushed the net short VIX balance to a record just recently. While these are valuable readings, total exposure offers a different picture.
When market participants find a point of equilibrium for exposure as prevailing market prices continue to rise - as is the case with S&P 500 emini futures - it can signal a flagging conviction that feeds concerns of complacency such as we find currently. In contrast, a steadily deteriorating participation as with the S&P 500 big contract can simply show the waning interest in a particular product. Where the benchmark US equity index continues to climb against a stagnant participation, the conditions reverse for EUR/USD. For the world's most liquid currency pair, two-and-a-half years of congestion hasn't throttled a swell The in open interest to record high levels. Adding depth to the unusual situation for VIX speculative positioning holding a record net short bearing, aggregate open interest has hit a record high. So not only is the market not treating this asset as a hedge to exposure, it is building this exposure aggressively. And, with an intense fundamental backdrop, open interest behind the 10-year Treasury note futures have hit a record high despite the change in tack for the Fed with rate hikes and now plans for a stimulus withdrawal. We discuss how participation can further our analysis - particular the range of extremes developing now - in today's Strategy Video.
To receive John’s analysis directly via email, please SIGN UP HERE.