


VIX, S&P 500, China, Recession, Fed and Dollar Talking Points:
- The Market Perspective: S&P 500 Bearish Below 4,075; USDJPY Bearish Below 134.00; EURUSD Bullish Above 1.0100
- A visit by the US Speaker of House to Taiwan has inflamed tensions between the world’s two largest economies – adding a third leg to the recession and rate fears
- Top event risk ahead is the US service sector activity report from the ISM, but don’t underestimate the headlines from China and unpredictable flare ups in recession chatter

Expected Volatility Measures Grew to Extreme in Their Quiet
When it comes to implied (expected) volatility measures, there is a certain revision-to-mean characteristic that is expected. If there isn’t a crisis-level event, it is likely that the VIX volatility index and its acolytes tend to deflate over time. While there has been meaningful retreat in the capital market benchmarks these past months, it is fair to say that there wasn’t much in the way of outright panic-like price action that would charge hedging costs to exceptional heights. That said, there is a point where the market can become too complacent in the face of tangible threats, and I do believe we had already passed that threshold. My assessing markets are ‘too quiet’ is one thing, for the financial system to come to the same conclusion usually takes an overt motivator to force balance. That recognition seemed to come with the headlines around a prominent US politicians visit to Taiwan, adding geopolitics to the threat of recessionary pressures and restrictive monetary policy that has dominated the fundamental scene of late. Just like the S&P 500’s slip, a check higher from the VIX and volatility of volatility index (VVIX) is best served with a clear charge for motivation rather than taking its traction on belief.
Chart of VIX Volatility Overlaid with the VVIX Index (Weekly)
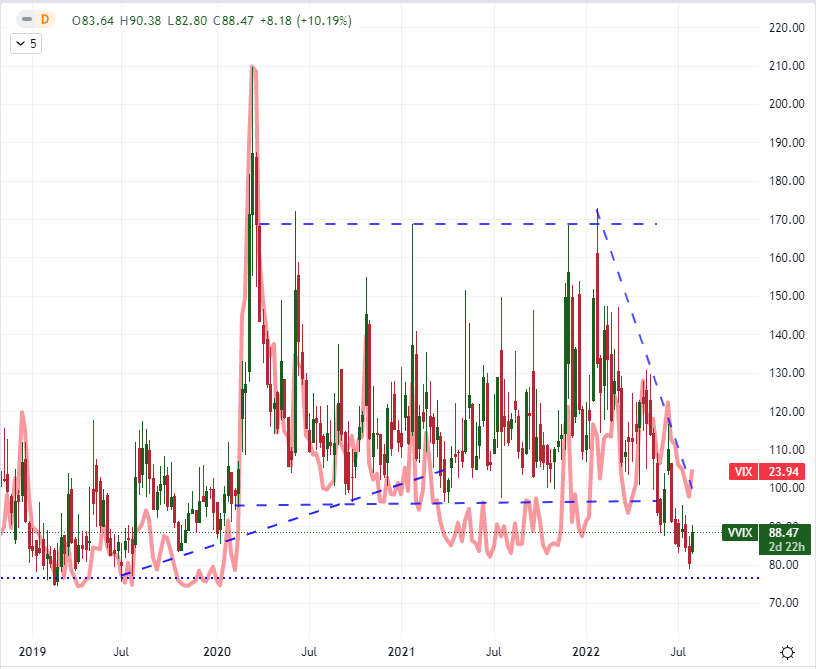
Chart Created on Tradingview Platform
While I find the course of implied volatility measure an important feature to monitor, its ultimate influence on price action for key financial assets is my ultimate interest. For the S&P 500 – which maintains a strong negative correlation to the VIX – a stir of concern has proven enough to arrest the bull phase at the midpoint of the March to June bear leg around 4,139. We have yet to drop below the range of the past 72 hours of trade, but that is my immediate technical concern in judging our short-term bearing. Among the other ‘risk’ leaning assets that I monitor, global indices, high yield fixed income and emerging market assets were all painting the same picture of reticence. Once again, the countertrend asset type was the Yen-based carries trades which finally jogged higher after days of stiff retreat.
| Change in | Longs | Shorts | OI |
| Daily | 1% | -1% | 0% |
| Weekly | 15% | -13% | -1% |
Chart of S&P 500 with 50 and 100-Day SMAs, Volume and COT Positioning (Daily)

Chart Created on Tradingview Platform
Geopolitics Adds a New Dimension to Fundamental Threats
We were already dealing with systemic concerns surrounding the course of global economic activity and the possible blowback from a too-stringent tightening of monetary policy, but there was also a building tolerance around this real-word threats. What better way to through investor confidence into disarray once again than to add a new element of fundamental chaos. Geopolitical risks are not exactly a new threat – just look at the fallout from the Russian invasion of Ukraine in the weeks after the initial sortie on February 24th. China is not an unusual flashpoint for global investors. The re-valuation of the Yuan back in August 2015 and the trade wars between 2018 and 2020 had the Western relationship with the world’s second largest economy front and center. News that US Speaker of the House Nancy Pelosi had indeed visited Taiwan in defiance of China’s warnings given its position on a ‘One China’ perspective set off a scope of possible concerns. At worst, it could trigger escalation to military engagement (which is a low probability) but it will almost certainly lead to a minimum of an economic retaliation which will bite an already struggling global economy. This matter can spread far for influence, but I will be watching the FXI China large cap ETF most closely as a sensitive measure.
Chart of FXI China ETF with Volume Overlaid with the Shanghai Composite (Weekly)

Chart Created by John Kicklighter with Data from FINRA
Meanwhile, I remain a firm believer that all the fundamental roads will eventually lead back to the status of economic activity. Chinese reports reportedly quoted officials as stating a 5.5 percent GDP target (not a hard one) has been proposed while cracks continue to show through in the local financial system such as news that Evergrande’s CFO has resigned. On a global basis, there were more than a few updates on economic potential around the world. Canada reported a slowdown in manufacturing activity – though that didn’t help along the GBPCAD reversal. The ECB warned that output could be suppressed by 0.8 percent in the medium-term owing to higher energy prices. I was most interested in the JOLTS job openings and quits data for June. The 605K drop in opening positions was the third biggest since the start of the century (after the pandemic’s forced shutdown), but it is happening from a higher starting point. Nevertheless, data like this will magnify the interest in Friday’s NFPs.
Twitter Poll on Whether the US is in a Technical Recession
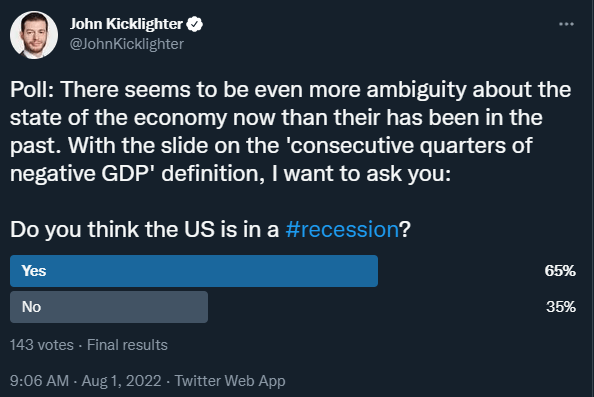
Poll from Twitter.com, @JohnKicklighter
What’s Ahead for Event Risk and Market Movement Potential
While Friday’s NFPs is acting like a bright beacon for event-risk traders, there is plenty of event risk in the interim that studious or active market participants should be keeping tabs on. While there are a number of relevant releases on tap, I am most interested in the ISM service sector activity report for July. Consider the attention paid to the factory activity equivalent on Monday with a meaningful change in the headline, employment and inflation gauges. Then, assess what the impact could be when we swap for a sector that accounts for approximately three-quarters of output in the economy and an equivalent level of jobs. In other words, this will be an important and perhaps dangerous proxy for general US GDP.
Global Calendar of Major Macro Economic Event Risk for the Next 48 Hours
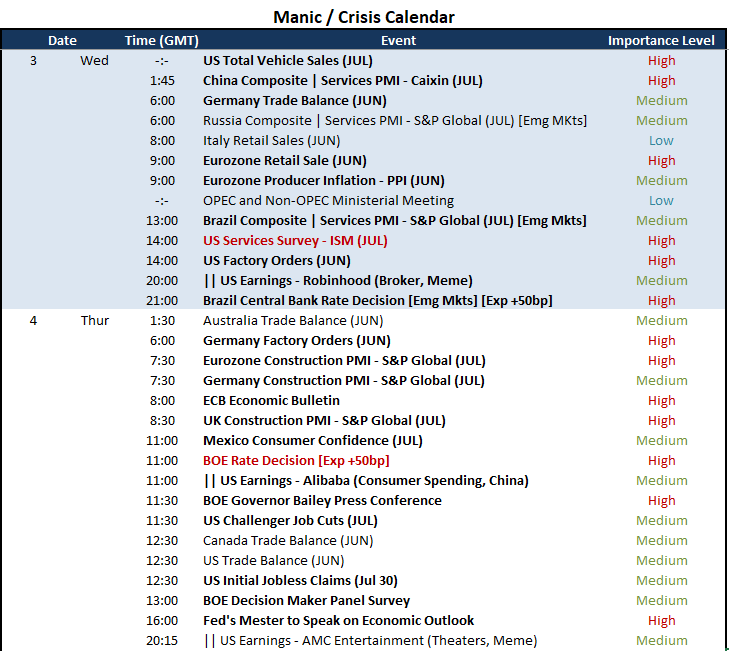
Calendar Created by John Kicklighter
When it comes to the tempo of economic expansion in the US, the implications for capital markets is fairly straightforward. For the Dollar, though, the safe haven status of the Greenback can make this a more nuanced discussions. Setting aside the possibility of panic or euphoria for the moment, the outlook for US interest rates has started to pick up once again. With remarks from SF Fed President Daly that the end in tightening is ‘nowhere near’ and Chicago Fed President Evans supporting a 3.75 – 4.00 percent end point and openness to a 50 or 75 bp hike in September, we are not seeing a strong dovish message arise. Let’s see if that confidence overrides the Fed Funds futures markets’ discount to the official market and in turn charges the US Dollar.
Chart of DXY Dollar Index with 50-Day SMA, Overlaid with the Fed Funds June 2023 Forecast (Daily)
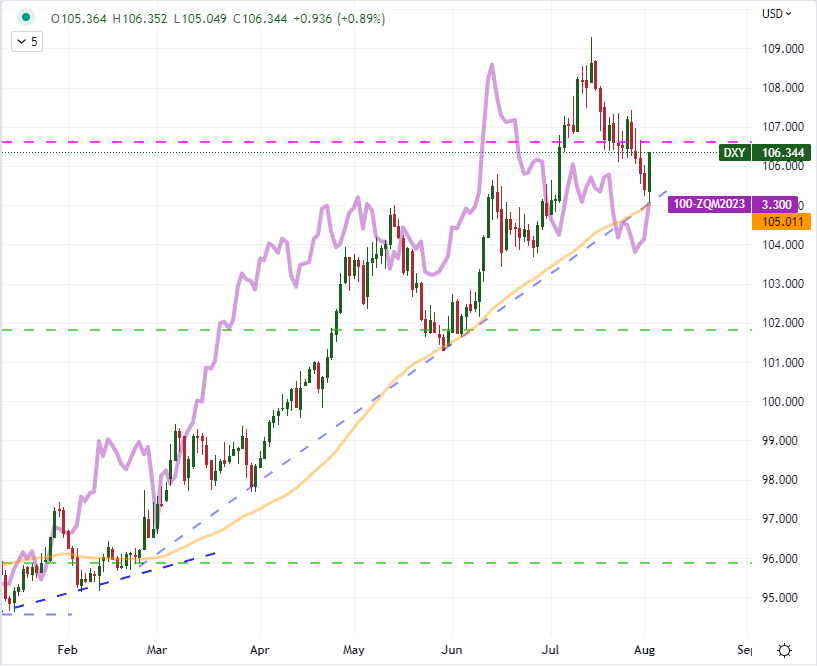
Chart Created on Tradingview Platform


