


S&P 500, VIX, Seasonality, China, Earnings, Fed, BOC and RBNZ Talking Points:
- The Trade Perspective: S&P 500 Bearish Below 4,075; USDJPY Bearish Below 134.00; Long NZDCAD Above 0.8050
- Seasonality influences held strong this past week, but the year’s most restrained average week doesn’t absolve a structurally higher rate of background issues
- Ahead, there is a significant run of top event risk including: China 2Q GDP, US CPI, BOC and RBNZ rate decisions, US earnings and the UofM consumer sentiment survey

An Uneasy Armistice for the S&P 500 and Risk
If the extent of your analysis over this past week was to look at how the S&P 500 – or whatever your favorite ‘risk’ designate may be – performed through Friday’s close relative to the previous week, you’d be left with a bullish impression. It would be shallow, but bullish nevertheless given the 1.9 percent gain from July 1st to 8th. Yet, it doesn’t take a deep dive to see that there are serious issues beyond the insights offered by up a weekly line chart. This past week was relying heavily on expectations connected to sentiment that will is thawing moving forward. Event risk is due to deepen significantly moving forward in both the number of releases as well as their importance to the core fundamental themes. And, perhaps most interesting of all for me is the active positioning against the bullish view. Contrast the modest climb from the S&P 500 against the lowest week’s volume since the Christmas holiday. Even more remarkable is the positioning of speculative futures traders who are expressing their most bearish exposure against the index since June of 2020.
Chart of S&P 500 with 50-Daily SMA and 4-Day ROC (Daily)
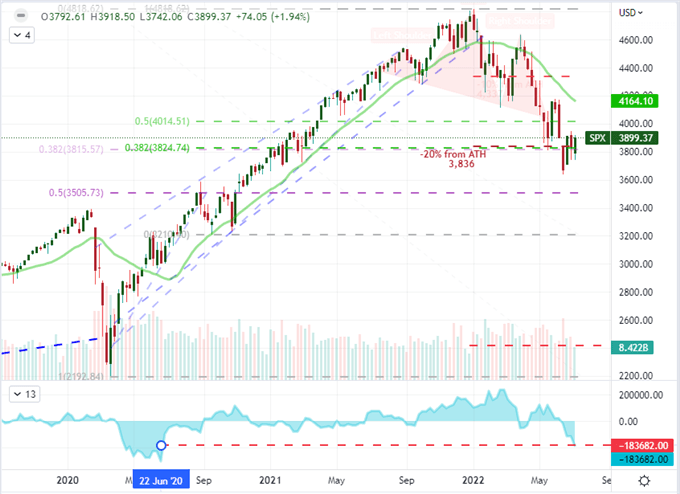
Chart Created on Tradingview Platform
It is not an exaggeration to say that there isn’t much confidence in the market’s progress this past week. That said, it was still a gain over the period that defied the fundamental odds. Through this past week, we were faced with a charged Fed rate forecast after June NFPs, countless data points taking pot shots at recession fears and upsetting geopolitical developments (UK Prime Minister Johnson resigning and former Japanese Prime Minister Shinzo Abe’s assassination). Nevertheless, the SPX and other caretaker speculative measures edge higher. I believe this is principally a result of the seasonal expectations. We passed through the 27th week of the year which historically experiences the nadir of volatility (VIX) and the second biggest speculative swell (SPX) of the year. We certainly saw those general trends this past week, but we weren’t pushing any records. The systemic environment is far more troubled than previous years, so the relief looks more like an overt temporary reprieve in a larger storm.
Chart of Weekly S&P 500 Performance
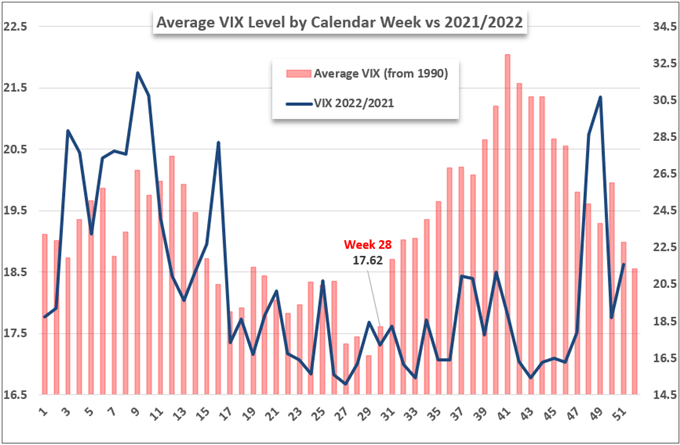
Chart Created by John Kicklighter
Top Event Risk and Top Themes for the Week Ahead – Starting with Recession Talk
Looking over the docket of high level event risk for the coming week, there is a surfeit of sparks capable of generating serious volatility for their local capital market and currency. The trick of transitioning volatility into trend is to tap into a deeper fundamental theme. There is plenty of fodder to achieve just that moving forward, starting with the ongoing debate over the threat of recession. There is no shortage of data that will cater to this critical macro observation for both short-term traders and long-term investors. There are targeted data points like US retail sales as well as comprehensive but adjacent measures such as the many sentiment surveys (Japan Eco Watchers, US NFIB business optimism, Eurozone ZEW investor sentiment) on tap, but top Western billing is Friday’s University of Michigan consumer sentiment report following the plunge to record lows at the last update.
Chart of US NFPs with Level of ‘Surprise’ between Expectations and Actuals (Monthly)
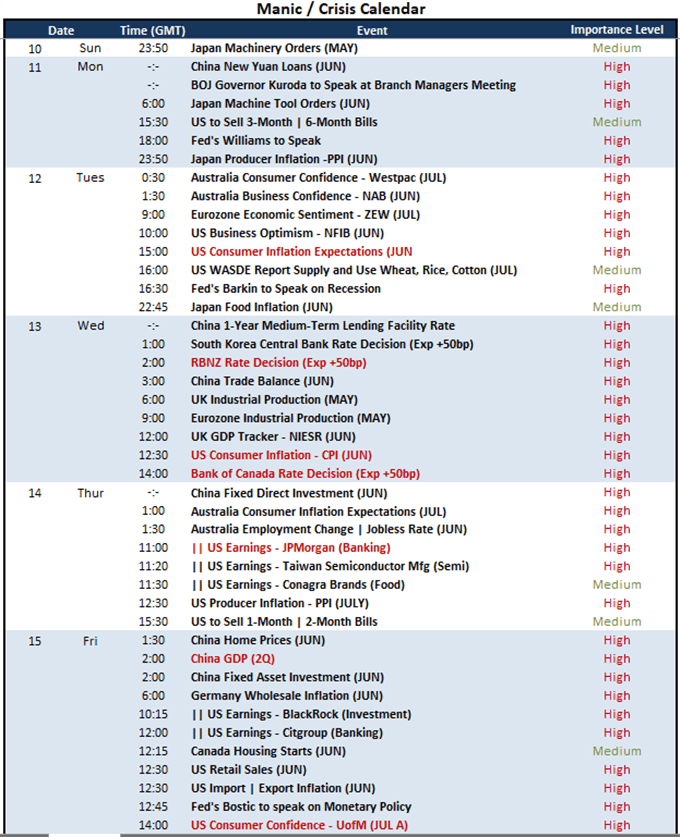
Chart Created by John Kicklighter with Data from the BLS
On the topic of recession watch, there is no more direct a path to a globally-important economic update than the Chinese 2Q GDP update. I generally take this data in with a grain of salt, but the past quarter will have to reflect the impact of forced economic shutdown resulting from the government’s effort to control Covid. As we take in this number, it is worth noting that there are signs that the government may be reinstituting these growth restrictive procedures as cases of new infection start to pop up. If we switch form singular event to most effective comprehensive theme, the award has to go to US earnings. While I will be watching key releases from the likes of TSM and Conagra, the focus is on the banking sector. Given their sensitive to growth forecasts, financial conditions and stress testing; this is much-watch GAAP.
Chart of USDCNH Overlaid with Ratio of Shanghai Composite to S&P 500 (Daily)
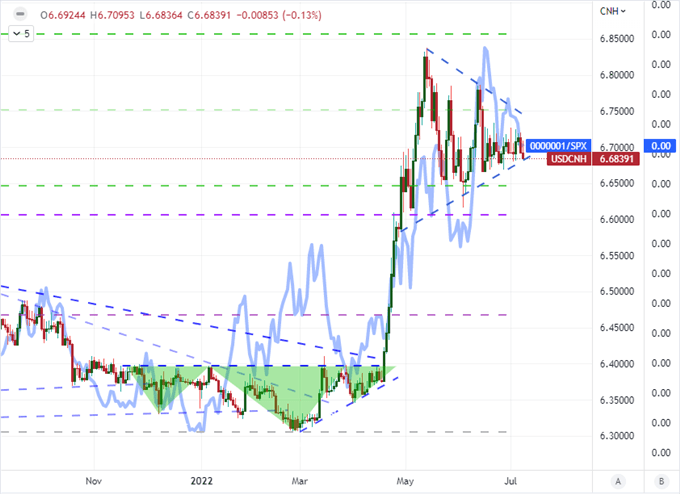
Chart Created on Tradingview Platform
Rate Speculation: The Other Fundamental Current
While I am watching monetary policy as an ongoing systemic theme in the week ahead, it is worth noting that it still exacts its weight through recession fears. The most hawkish major central banks have made clear that in their battle against sticky high prices, they are more than willing to suppress growth. While they wouldn’t say they are looking to trigger a recession in order to return inflation to palatable levels, it looks as if the market believes this could be part of the calculus. Nowhere in the developed world is this debate as heavily playing out as in the US. After the June NFPs beat expectations this past Friday, the market seemed to translate the data into a green light for the Fed to hike another 75bps on July 27th rather than it reflecting any real relief on the economic front. The DXY Dollar Index did stretch further after the news, but the question is how much of this aggressive outlook is already priced into the Greenback’s multi-decade highs? Below, I compare the Dollar to rate forecasts through the end of 2022 and then the expectations (of rate cuts) in the first half of 2023.
Chart of DXY Dollar Index (Quarterly)
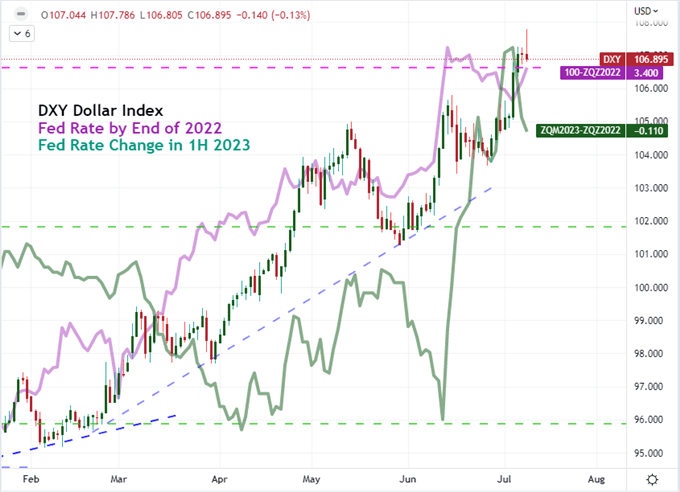
Chart Created on Tradingview Platform
Over the past few months, interest rate speculation has surged across the board – with notable exceptions in the Bank of Japan and People’s Bank of China. After series of hikes and moves of 50 and even 75bps among developed world policymakers, we have seen an aggressive upgrade to the forecasts for the Fed, BOE, BOC, RBNZ, RBA and even the ECB. But how much is there to still price in? The two most provocative central bank decisions on my radar are the FOMC and ECB, but they are still a few weeks out. For now, I’ll need to make due with data like the US CPI release on Wednesday.
Relative Central Bank Monetary Policy Standing
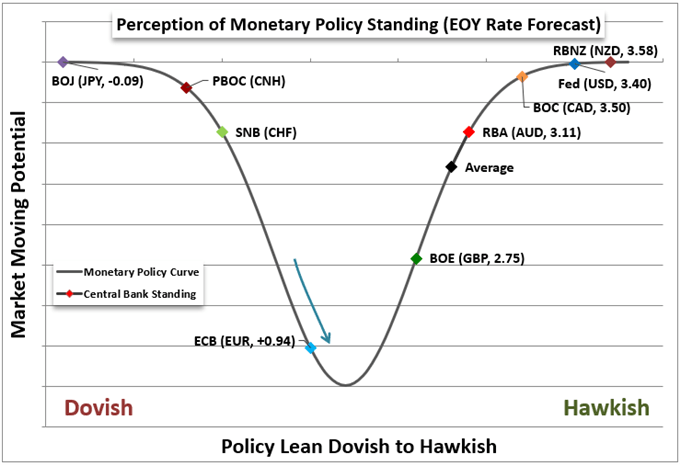
Chart Created by John Kicklighter
If you are looking for direct feedback on interest rate policy, then look no further than the NZDCAD. This is not the best pair to respond the Reserve Bank of New Zealand (RBNZ) and Bank of Canada (BOC) rate decisions this week, but it certainly finds itself in the center of the action. Both central banks are seen hiking their respective benchmarks another 50bps with the former expected to hit a 3.58 percent by year end while the latter reaches 3.50. In general, the Canadian Dollar has benefit its hawkish course, but it has been anything but a straight line move even for pairs with more extreme rate contrasts. That said, the New Zealand Dollar has generally acted as if it is actually facing rate cuts. The disparity in yield forecast and currency response is the position the Kiwi reflects with low liquidity that overrides the appetite for higher rates. But perhaps an even bigger increase could change that blend?
Chart of NZDCAD Overlaid with New Zealand – Canada 2-Year Yield Differential (Daily)
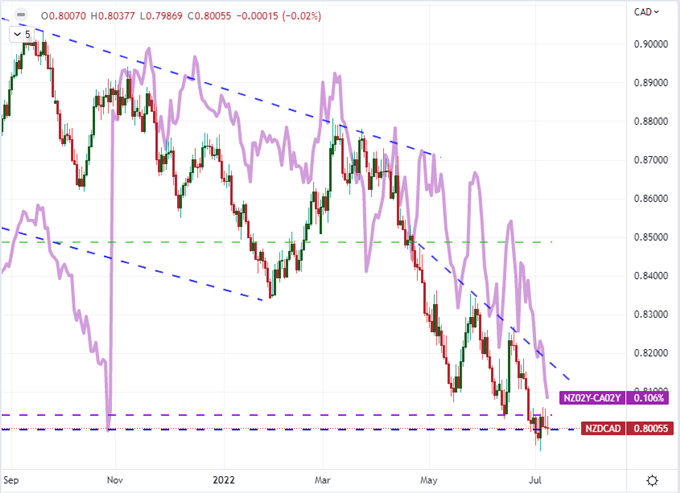
Chart Created on Tradingview Platform


