


Dollar, EURUSD, VIX, Recession, Fed and Gold Talking Points:
- The Trade Perspective: S&P 500 Bearish Below 4,075; USDJPY Bearish Below 134.00; Bullish EURUSD Above 1.0350
- While US indices – as a benchmark for ‘risk trends’ – is churning without conviction; there has been a notable volatility along recession, rate forecast and localized systemic risk lines
- A Dollar rally seems a product of EURUSD’s pain, gold has plummeted, Treasury volatility is off the charts and

What the ‘Traditional’ Risk Benchmarks Say Versus Current Circumstances
There remains a serious disparity between what the seasonal norms would suggest lies ahead versus what the systemic issues would suggests is on the tap for the immediate future. And, in that contrast arises speculative opportunism. Looking at our current scene, we are met with a financial backdrop that looks like the fundamental makeup of a financial crisis in the making – whether it originate from a recessionary backdrop or financial seizure. On the other hand, the seasonal pull is strong. Historically-speaking, we are entering the ‘summer doldrums’ which are notorious for anchoring ambitious markets. It would be a particularly-presumptuous period to simply assume that the markets are going to revert to extreme quiet when recession and liquidity are dangerously imminent. From the S&P 500, we see the ambiguity of a drift higher that has pushed the index back above the level that defined the current ‘bear market’ without the commitment to suggest a lasting bull trend may be bearing roots. I am of the mind that a significant move is likely to take traction among bears rather than bulls given our key themes and technical mix at present.
Chart of S&P 500 with 20-Daily SMA, Volume, 5-Day Range and ATR (Daily)
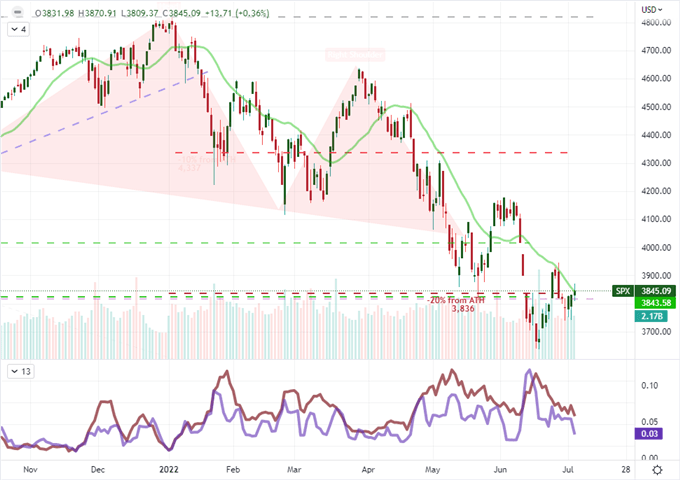
Chart Created on Tradingview Platform
It can be difficult to entertain the possibility of a bearish market when historical norms suggest the potential for performance on the opposite end of the spectrum. Given the threat of recession and the fallout from a hawkish monetary policy regime, I would say that there is a nature curb to bullish interests over the immediate future; but that would ride against the historical norms. Averaging out weekly performance, the S&P 500 tends to record its second best week of the year through week 27 in large part to the expectations around liquidity. I don’t think those are practical norms at present, so traders should be wary to take historical averages at face value.
Chart of Weekly S&P 500 Performance
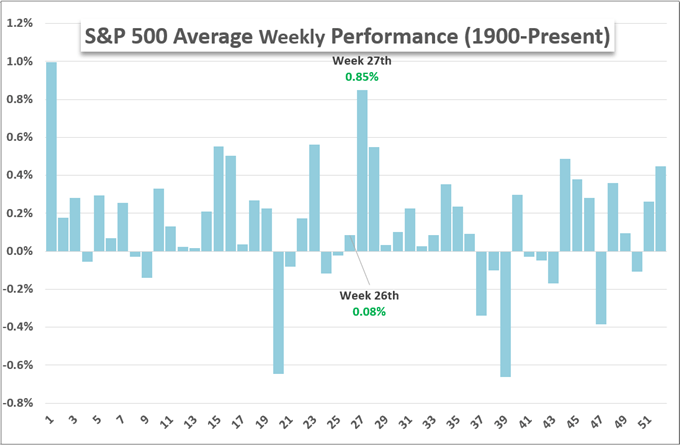
Chart Created by John Kicklighter
On another front of the seasonal traditions, the ‘expected volatility’ measure in the VIX volatility tends to register its lowest average reading (since inception) of the year through the current week. The July 4th holiday naturally represents a curb to the typical 5-day week, but there is more assumption built into this period which facilitates such technical curbs. Once again, I don’t think the markets are well positioned for such price restriction going forward, which should keep traders on edge moving forward.
Chart of Weekly Seasonal Performance of VIX Volatility Index
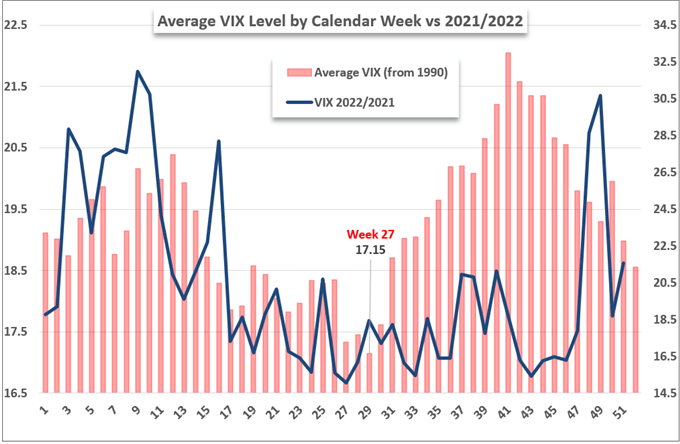
Chart Created by John Kicklighter
The Risk of Recession is Growing Once Again
While the S&P 500 is struggling for bearing, it is important to recognize that the fundamental priorities are not similarly up in the air. In fact, the recognition of recession risks is displayed very prominently in leading risk measures. In addition to the slump in crude oil (for demand purposes), we have seen the US 10-year to 2-year yield differential (often considered a ‘recession’ signal among investors) flip back into negative territory this past session. While the results are still preliminary, the poll I ran asking traders what they thought the chances of a US recession have increased sharply towards an unfortunate confidence. In market terms, that speculation continues to build in Treasury volatility and the ‘2-10 spread’, but I’m looking for the spillover of recognition to crash into the traditional capital markets.
Chart of US 10-Year / 2-Year Yield Differential (Daily)
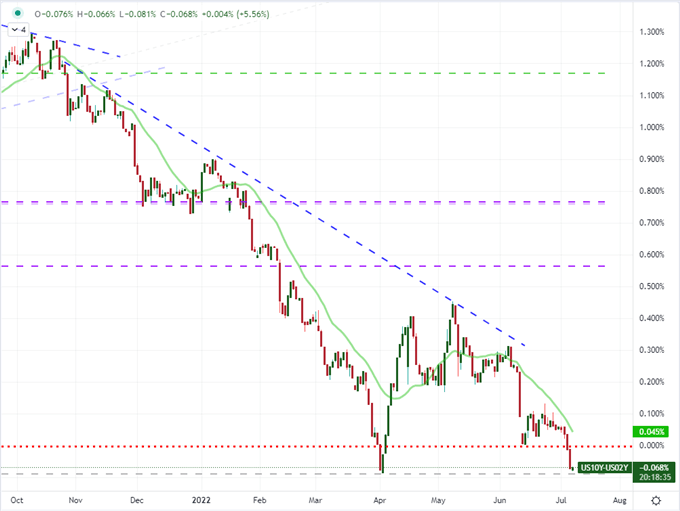
Chart Created on Tradingview Platform
From a data perspective, the systemic themes of ‘recession risk’ and relative monetary policy perspective favor activity on the former front. This past session, the ISM released its June activity report for the service sector – the largest segment of the world’s largest economy. While the headline figure managed to register a smaller slip than was expected, the drop in the employment figure (47.4 versus 50.3 expected) should represent serious concern. We may be far from the absolute low registered in April of 2020, but this is a reading that does not bode well for the general trend.
Chart of ISM Service Sector Employment Component (Monthly)
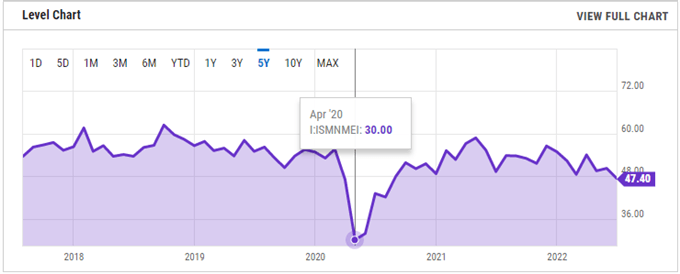
Chart Created on Y-Chart with Data from ISM
As a gauge spanning both the world of economic potential and monetary policy, the US employment course will represent a point of serious speculative contention moving forward. The ISM service sector report may dampen recession fears for a spell, that labor component slump is a serious threat to the US economy. It also amplifies the focus on the next 48 hours key data. The Thursday ADP private payrolls survey will take on a greater weight thanks to the ISM survey, with a meaningful miss stoking a far bigger move on risk aversion than an equivalent beat would rouse the bulls to life. And, of course, all of this is a prelude to Friday’s nonfarm payrolls (NFPs); which is a market favorite for growth and rate watchers.
Calendar of Major Global Economic Events
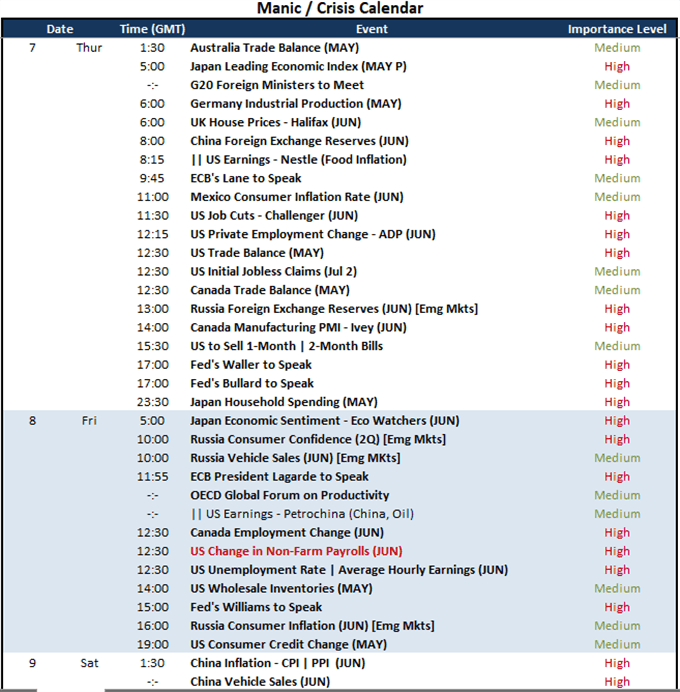
Calendar Created by John Kicklighter
Monetary Policy – On the Other Hand
While I am particularly interested in the outlook for recession among market participants, this isn’t a self-fulfilling fundamental course that that can be fully relied upon for market volatility nor certainly for full-fledged trends. Tightening policy reins tends to fly in the face of recent convention where stimulus is offered up to promote stability in the financial system. Yet, the Fed and others have made clear that their wells are not limitless. Notably this past week, we have seen the Dollar surge without a commensurate direct value infusion. I think a lot of the Greenback’s uplift is a by-product of the Euro’s own slide as rate and growth forecasts flounder. I still maintain that my preference on EURUSD would be a swing high that sees the Fed rate forecasts erode, but setting meaningful technical barriers that help develop plans.
Chart of EURUSD with 20-day SMA and 2-Day Rate of Change (Daily)
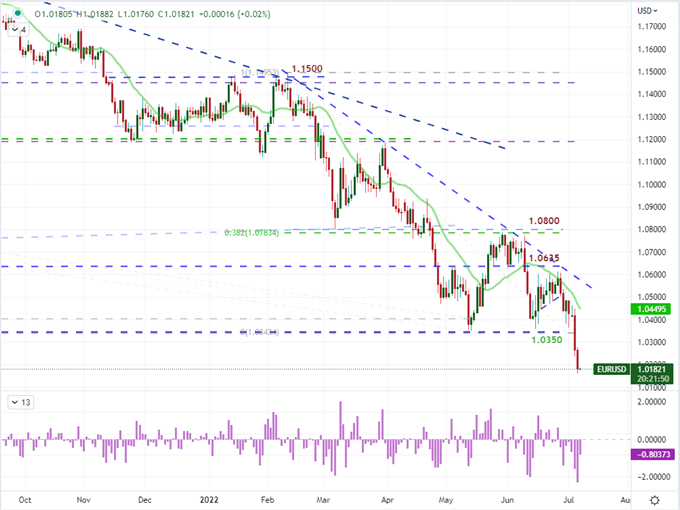
Chart Created on Tradingview Platform
While I am keeping close tabs on the artificial means of growth and interest rates, there remains very direct measures of growth concerns via monetary policy channels. Notably, the Dollar rallied to a new two-week high this past session, but there is little relative growth, rate forecast or safe haven status in play. Alternatively, the go-to market for a hedge against inflation and oft-ultimate safe haven has tumbled to lows not seen in may moths. In fact, gold’s drop over the past few months is the biggest slide in years. Perhaps this metal is no longer needed as a haven or its general luster has flagged. I will be watching the picture closely with 1650 support at the very front of mind.
Chart of Gold with 200-Week SMA and Net Speculative Futures Positioning (Weekly)
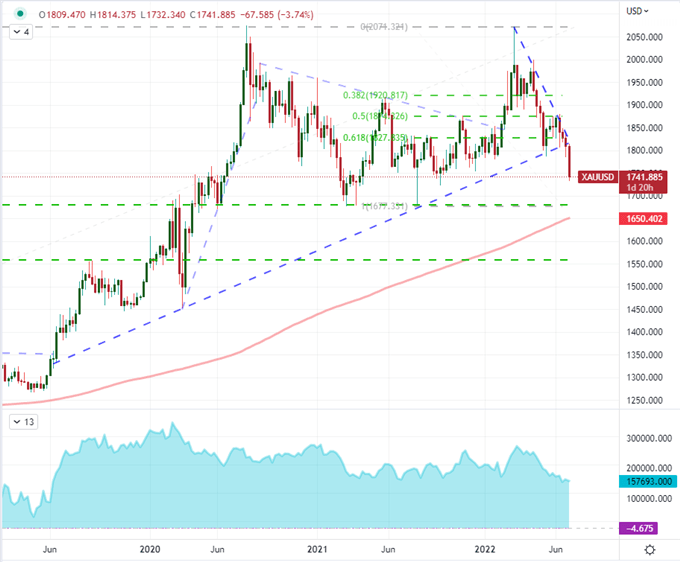
Chart Created on Tradingview Platform


