


S&P 500, VIX, Monetary Policy, USDJPY, GBPUSD and EURCHF Talking Points
- The Trade Perspective: S&P 500 Bearish Below 4,075; USDJPY Bearish Below 134.00
- After the brief bout of indecision that followed the FOMC decision, the bear market re-instituted itself this past session with the S&P 500 falling from 3,835
- Rate moves (BOE and SNB) have added to risk aversion and stoked FX volatility, market volatility, BOJ and recession fears are key focal points

A Return to the Bear
While there was some brief respite in the confusion that followed the FOMC’s hefty 75 basis point rate hike Wednesday, the market has quickly returned to its prevailing bearish trend. The bear market we entered with the S&P 500 to start this week is an extension of a trend that has developed throughout 2022 and backed by hefty fundamental concerns from destructive inflation, tighter financial conditions and ballooning fears of recession. While it is always possible to muster a market turn on sentiment alone, there seems little foundation for speculative opportunities – and the fundamental scape is outright a concern. In the aftermath of the post-Fed commotion, we have seen some fairly textbook technical development. The same technical level that defined the S&P 500’s drop into a ‘bear market’ switched from former support to new resistance. A -1.6 percent gap down on the open Thursday ultimately turned into a -3.2 percent loss on the day and the lowest close in 18 months.
Chart of S&P 500 with 20-Day SMA with Volume and Daily Gaps (Daily)
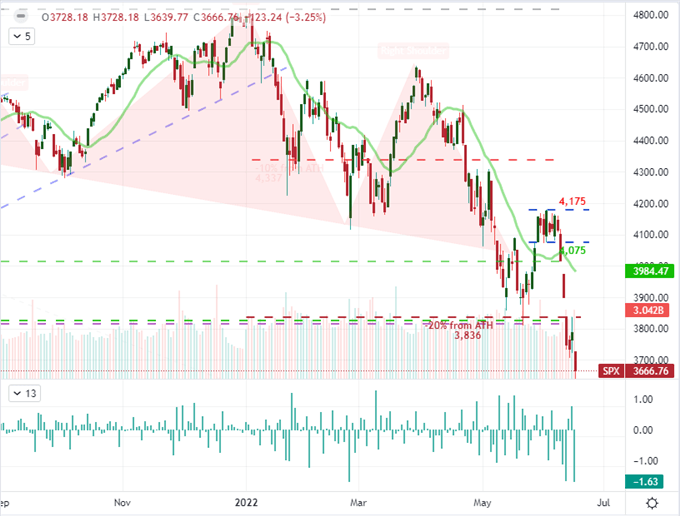
Chart Created on Tradingview Platform
As we dive back into a progressive – and broadly based – bear trend, I am focusing on the market’s tempo. While the benchmark S&P 500 is down a remarkable -23 percent on the year, that doesn’t mean that we *must* find a bottom soon. While the 2020 bear market played out in little more than 2 months – a dramatic tumble to say the least – the 2007-2008 bear trend played out over 16 months and the 2000-2002 bear wave took 25 months to find its bottom. Fundamental balance would be an ideal foundation to provoke the market’s recovery, but curbing rampant inflation and heading off an economic slump takes significant time. The more rapid about face would come through a turn in sentiment, but what would signal to the market in this environment that a possible floor could be in place? I hold with my colleagues Paul Robinson and Christopher Vecchio that a VIX surge above 50.0 would be a good starting point.
Chart of VIX Volatility Index and Baseline Extreme Levels Overlaid with the S&P 500 (Weekly)
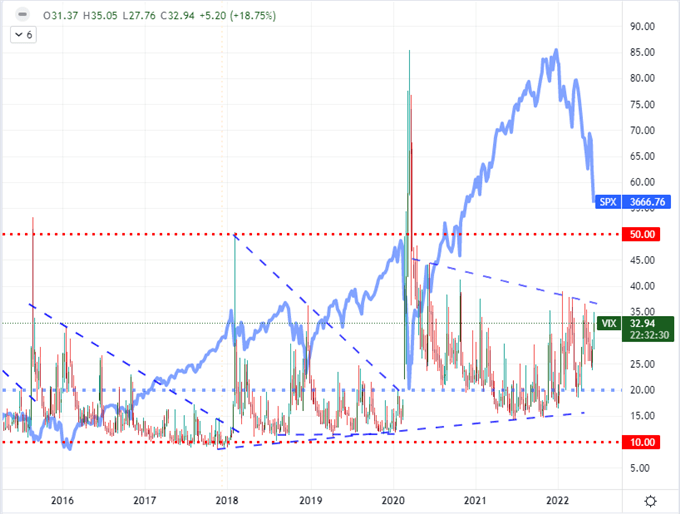
Chart Created on Tradingview Platform
Where Sentiment Meets Fundamentals
As the risk-inclined lose control of the wheel once again, we are seeing the more buoyant of the benchmarks over these past few days are suffering a steeper retreat. The S&P 500 and was among the more charged measures while the likes of the EEM emerging market ETF are and HYG junk bond ETF were holding off of the new multi-year lows. Among the spectrum of risk assets I monitor most often, the Yen pairs are far-and-away the most extended in favor of ‘risk on’ thanks to the rapid increase in interest rates and interest rate expectations. Yet, as quick as the rate hikes have been in historical terms, they are far behind the clip of inflation pressures. And, that economic volatility spills over into financial instability. Recognition of that disparity seems to just now be catching up to the market. From my favorite market – USDJPY – we have flipped from a temporary breach of 24-year highs to the biggest two-day slide since March 27, 2020 (during the pandemic). As intense as the pullback is, it is only marginally off the highs with plenty more premium built into the market.

Chart of USDJPY with 20-Day SMA and Consecutive Candle (Daily)
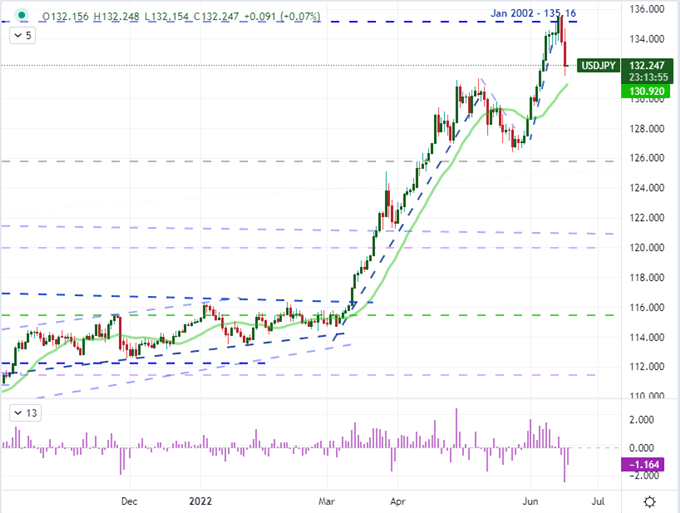
Chart Created on Tradingview Platform
When it comes to the USDJPY and Yen crosses, monetary policy continues to dominate the fundamental picture. The projection of these pairs is founded on the recognition that the Bank of Japan is perhaps the last holdout among the major central banks that are looking to fight rampant inflation. That unique situation may not last forever however. The Bank of Japan is on tap Friday morning in Tokyo (no official time given) and the expectation is no change from the commitment to supporting growth through extreme accommodation. Yet, the risk to credibility may slowly be eating away their commitment. What’s more, the yield differentials that the crosses represent are not rising at the same clip as expected volatility. If the BOJ even hints at shifting its attention to inflation, expect the yen crosses to outright tumble (Yen rally). Outside of the Yen pairings, the carry trade potential continues to narrow as most central banks pursue tightening – albeit at different tempos. So, pairs like EURUSD, GBPCAD and AUDNZD are not so straightforward.
Table of Major Central Bank Relative Policy Stance with Expected EOY Rate Forecasts
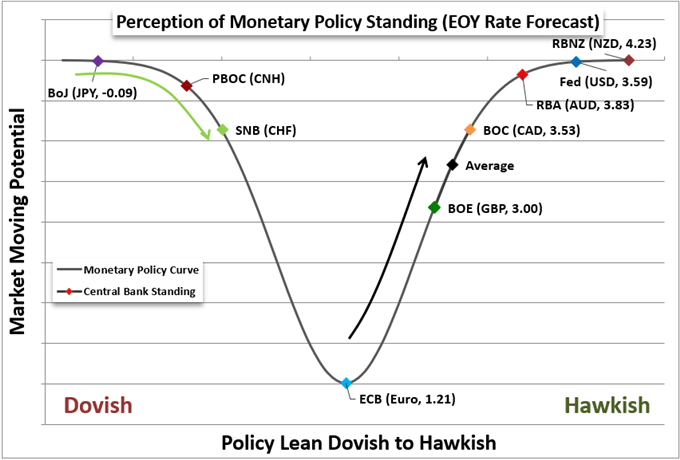
Chart Created by John Kicklighter
Monetary Policy that Meets Expectations and Monetary Policy that Surprises
While this week’s top event risk was undisputed in the FOMC rate decision, it wasn’t the only proven market mover. The Bank of England (BOE) rate decision this past session leveraged a significant rally from the British Pound – despite its policy announcement merely ‘meeting expectations’. The 25bp hike was notably more restrained than its US counterpart’s 50bp move; but where the Dollar has slipped after its central bank’s announcement, the Sterling has advanced after its own group’s move. Why the difference? While the actual rate increase matched expectations, the forecast for likely 50bp moves in the future outpaced expectations. Let’s see if it is enough to push GBPUSD above 1.2500.
Chart of GBPUSD Overlaid with the UK-US 2-Year Yield Differential and 2-Day ROC (Daily)
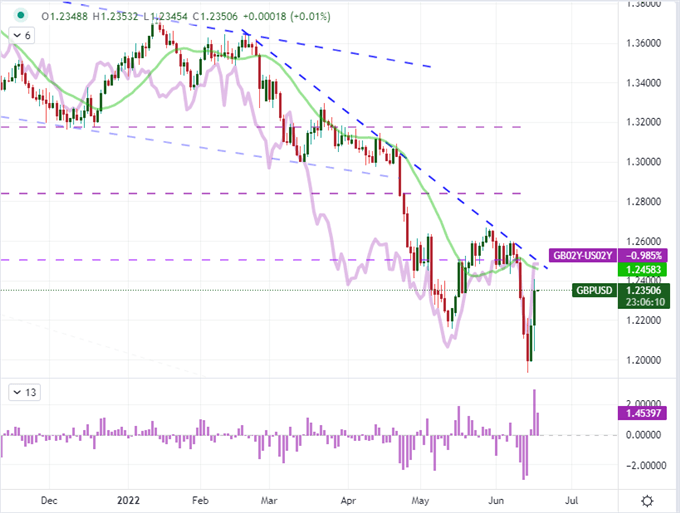
Chart Created on Tradingview Platform
Where the BOE met expectations with its policy mix at this particular meeting, the Swiss National Bank (SNB) caught the market totally off guard. While the Swiss group’s general policy approach is to ‘be more dovish than the ECB’ in order to keep the Franc from surging, its larger counterpart has only escalated its warnings for a change in bearing in the future. Perhaps in a bid to regain some of its (seriously degraded) credibility, the SNB announced a 50bp hike at this meeting which still left the benchmark rate at -0.25 percent. Nevertheless, the result on EURCHF was the biggest single-day drop since January 15, 2015 when the group made the disastrous policy move to remove the floor from underneath the exchange rate. If the ECB follows up with a rate hike next month, this threatening slump from EURCHF is less likely to turn into another systemic problem.
Chart of EURCHF with 20-Day SMA and 1-Day Rate of Change (Daily)
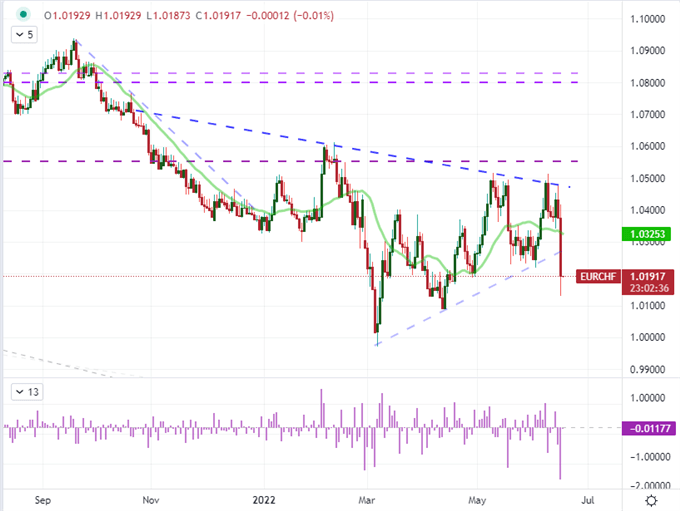
Chart Created on Tradingview Platform
A last point to consider beyond the short-term. While we are currently in the middle of considerable rate speculation and the speculative mix it incurs, I think it is important to keep a close watch on the perception around possible economic stall out. We have seen economic warnings accompany the various central bank decisions this week which has added to the supranational groups that have indicated they will be downgrading their own projections in the near future. As for the market’s view, you can watch the US 2-10 yield spread but Google search interest in key terms like ‘recession’ as below can offer a useful gauge.
Google Search Interest in the US for ‘Recession’, ‘Bear Market’, ‘Rate Hikes’ and ‘Earnings’
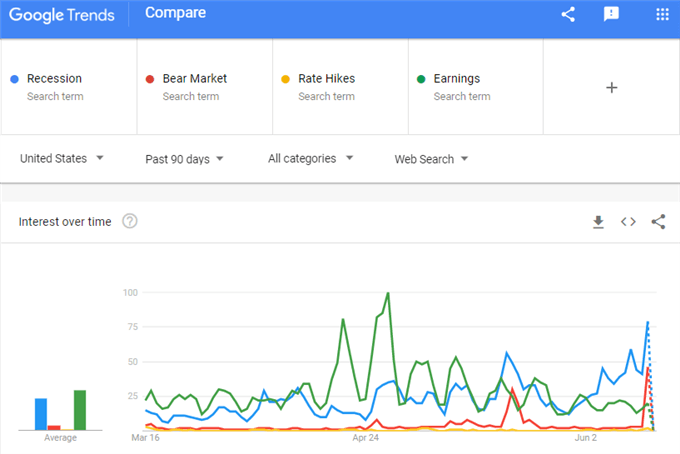
Chart from trends.google.com/trends


