


S&P 500, Liquidity, GDP, China Dollar and EURCAD Talking Points
- The Trade Perspective: S&P 500 Bearish Below 4,000; USDCAD Bullish Above 1.2500
- A 1.8% rally from the S&P 500 nudged the index to a one-month high, but we have barely nudged its range…all while volatility readiness is dangerously low
- Top themes in inflation, rate forecasts and growth forecasts along with key event risk of NFPs and the ISM services report, makes the Dollar a lightning rod

S&P 500 Hits a One-Month High: Inspiring or Wind Up?
We are heading into the final session of the trading week with a positive trend in risk assets, a remarkably sanguine picture of potential volatility and the anticipation of major event risk on tap. These are not exactly impossible conditions to coordinate, but it creates a platform whereby the market is prone to a ‘surprise’ reversal in sentiment. As it stands, the S&P 500 made an impression along with its major US counterparts by advancing 1.8 percent to close at its highest level since May 4th. On paper, that may seem impressive progress, but it is hardly a remarkable move in terms of pace given the ATR over the past month. Further, we only modestly edged out that high. From the near-miss of a ‘bear market’ close two weeks ago, the index is now 9.6 percent higher from its lows. With so overt fundamental headwinds, I still see this as a bear market bounce; but the rise can continue until so long as it isn’t hammered back by sentiment or fundamental update.
Chart of S&P 500 with 20-Day SMA, Daily ‘Wicks’ and 20-Day ATR (Daily)
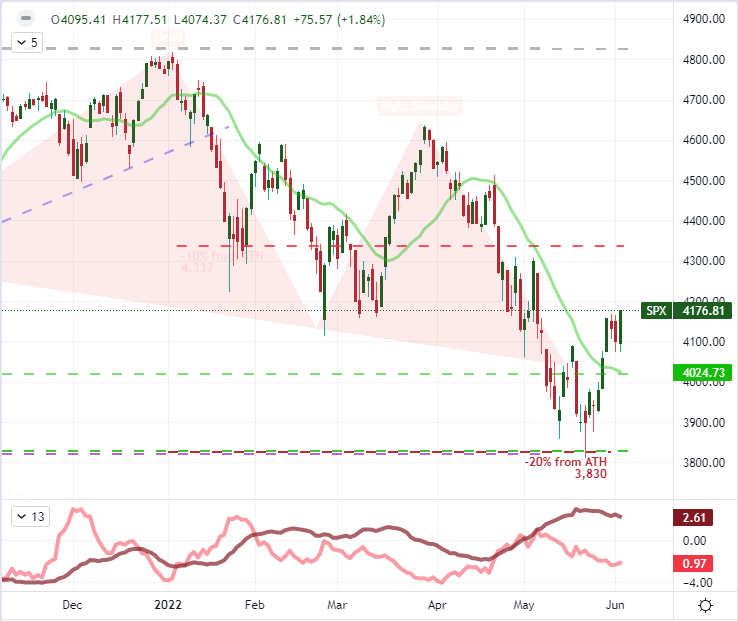
Chart Created on Tradingview Platform
Generally-speaking, the market can turn with little notice and on a less-than-ground-breaking update. However, I believe conditions are particularly conducive to seeing a dramatic rather than measured turn. There has been a slow tempering of volatility for the benchmarks like the S&P 500 with the progress of the bounce. That said, the ‘realized’ measures of activity (like the ATR) remain exceptionally elevated. As for the ‘implied’ gauges, the VIX volatility index is still above its 200-day moving average; but it is the extreme bearing on the ‘volatility of volatility’ VVIX index that truly stands out. Having dipped below 90 during Thursday’s trading session on a six consecutive day slide, it is increasingly obvious that the markets are not well positioned for any sudden changes in direction and tempo. Ill-preparation tends to result in messier response; and it is a rule of thumb that ‘fear’ tends to hit the markets far harder than ‘greed’.
Chart of VVIX ‘Volatility of Volatility’ Index and Consecutive Daily Moves (Daily)

Chart Created on Tradingview Platform
Most Fundamental Roads Lead to the Dollar
Heading into the final trading day of the week, it is important to keep track on general ‘risk’ assets; but there is a particular market that will find itself positioned at the crossroads of most fundamental waves – whether they swell or not. The Greenback had a particularly active session Thursday with the DXY Dollar Index notching a -0.8 percent correction that quickly killed the recovery effort from earlier in the week. The rebound in risk trends undermines the safe haven appeal of the benchmark currency, but that doesn’t seem to have seen a particularly meaningful influence lately. Instead, a curb in the relative advantage of US growth and drift away from Fed rate expectations seems to be a more active driver. While I am watching the Dollar for its own performance, my interest in the crosses is particularly honed in on the EURUSD’s bounce between 1.0800 and 1.0650 as well as USDCNH as it carves out a large reversal amid political crosswinds.
Chart of DXY Dollar Index with 50 and 100-Day SMAs, 1-Day ROC and 20-Day ATR (Daily)

Chart Created on Tradingview Platform
When it comes to event risk through this final session, there is a monthly seasonal interest in the release of the US monthly labor report. The nonfarm payrolls are perhaps the most recognizable economic release for traders and non-traders and that ubiquity tends to lead to greater market response as the data tends as the speculative rank attempts to price the data into the capital barometers. The consensus amongst economists stands at a 325,000 net increase in payrolls for the month of May which would be a meaningful slip from the previous reading’s performance. That said, the ADP private payrolls figure released Wednesday suffered a significant shortfall relative to the consensus forecast. The signaling power of the early reading is not particularly robust as it relates to the official government reading, but it still sets the tone. The real question is whether the employment states – payrolls, jobless rate, earnings, etc – carries a greater influence for interest rate expectations or confidence in growth forecasts.
Chart of Change in NFPs, Change in ADP Private Payrolls and Differential (Monthly)

Calendar Created by John Kicklighter with Data from BLS and ADP
What Carries More Weight Friday and Beyond: Monetary Policy or GDP?
When it comes to interest rate speculation, there seems to be a moderation in the day to day swings that follow the theme. The relentless charge for the Dollar from February to mid-May – as expectations for consistent rate hikes rose to include a series of 50bp moves and peaked at extreme anticipation of one or more 75bp increases – seems to have plateaued. That said, Fed rate expectations aren’t simply succumbing to a steady path of retrenchment as was seen in Fed Fund futures this past session. While the 50bp rate hikes at June and July meetings are still firmly rooted (with some modest speculation of a 75bp move in that time frame), we have seen the outlook for a further 50bp move at the September 21stjumped back up to 70 percent from 37 percent just a week ago. Clearly, this is an active theme; but I just don’t think the employment leg of the dual mandate carries great potential to meaningful sway the Fed’s course shy of an extreme change.
Table of Probable FOMC September Rate Level According to Fed Fund Futures
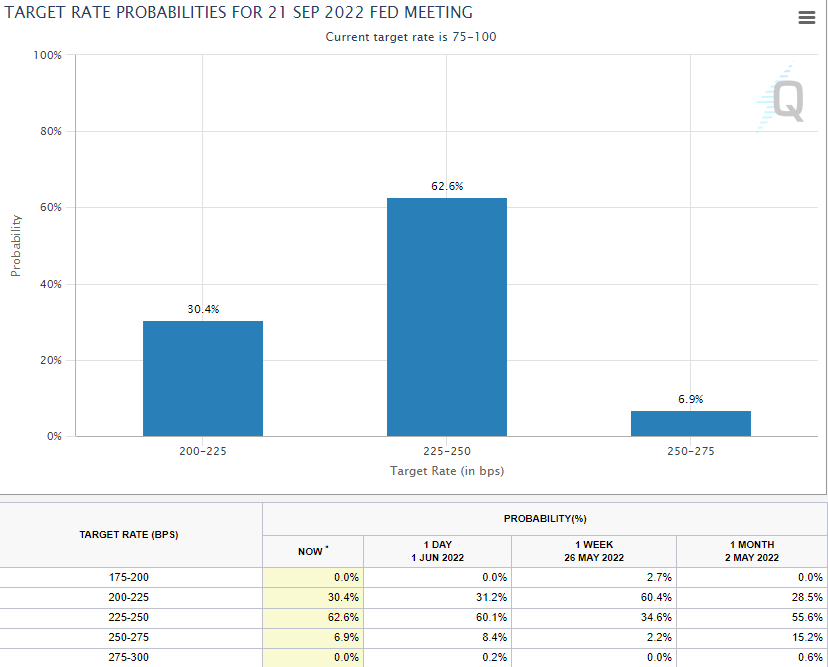
Chart Created by John Kicklighter
In contrast to the monetary policy implications of the upcoming jobs report, the impact for growth forecasts faces a more sensitive landscape. We have seen the outlook for economic health drop materially these past few months through IMF forecasts, PMI figures and warnings from the White House (in the case of the US). We are due an update on the OECD’s forecasts next week; but for the time being, the labor report can offer an important milestone of ‘actual’ figures. That said, the more influential economic reading on my docket compared to the NFPs is the ISM service sector report for May. This report reflects on a segment of the economy that represents more than three-quarters of output and jobs. An uptick could offer relief so long as it doesn’t come with as many caveats as its factory counterpart released earlier this week. Should it present an out right miss, be warry of both the implications for the S&P 500 and the Dollar.
Chart of S&P 500 Overlaid with US Service and Manufacturing Activity from ISM (Monthly)
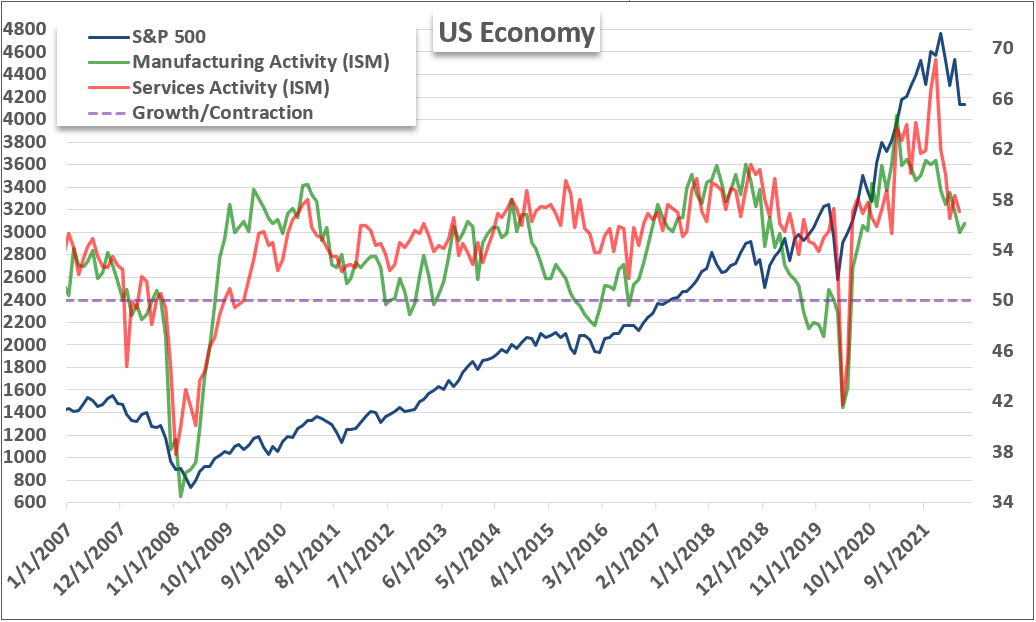
Chart Created by John Kicklighter with Data from ISM


