


‘Risk’ Assets, S&P 500, COVID, Dollar and Rates Talking Points
- Risk appetite will open 2022 on a strong footing, but the disparity in relative performance is perhaps as remarkable as benchmarks like US equities hitting records
- Seasonality statistics suggest benchmark ‘risk’ measure S&P 500 averages its best performance of year on the first week and January overall is typically strong
- Traders have been acutely aware of the fundamental troubles in the background and deftly overlooked the concerns, but this is unlikely to go on forever

Risk Appetite Is Strong…For Some Speculative Measures
As we close out the trading year, I find the dominant theme of speculative appetite overriding fundamental concerns so prevalent throughout 2021 has maintained its control into the final hours. There have been a few seismic shifts across the financial system through the course of 12 months including: an ongoing recovery from the pandemic; an ebb in new fiscal stimulus; a retail trader boom and the slow turn in global monetary policy. Yet, throughout the turbulence, the confidence in – or more reasonably ‘appetite for’ – riding the bullish wave has persisted. Though I see it every year, the number of people that have said to me that they are swearing off fundamental and/or technical analysis as it ‘no longer matters’ is perhaps as high as I have seen it in decade. Conviction still matters but it can be watered down when derived in crowds. While there is a strong probability that risk appetite can continue to cost through the opening weeks of the new year, the disparity in different speculative measures suggests there is exaggeration that will moderate. In particular, I’m watching the Nasdaq-to-Dow, S&P 500-to-‘rest of world’ indices, equities-to-‘other’ ratios where exuberance has hit manifest extremes.
| Change in | Longs | Shorts | OI |
| Daily | 1% | -1% | 0% |
| Weekly | 15% | -13% | -1% |
Chart of Year-to-Date Performance of ‘Risk Assets’ Including S&P 500 (Daily)
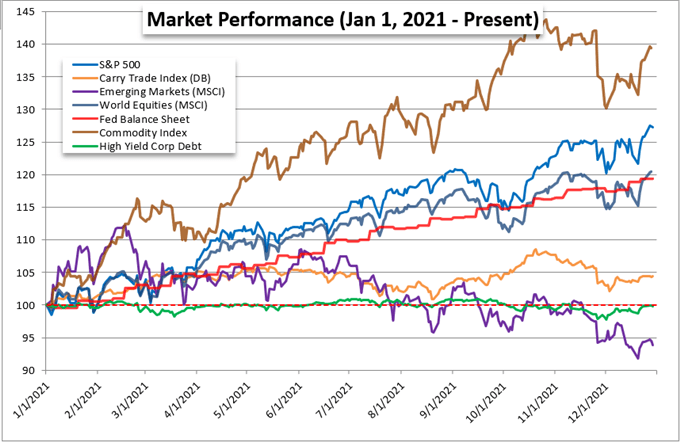
Chart Created on John Kicklighter with Data from Bloomberg Terminal
I consider myself to be more of a skeptic and tend to question prevailing trends whether they are bullish or bearish, ‘risk on’ or ‘risk off’. There are plenty of issues I take with he prevailing advance in speculative assets led by the S&P 500, but value is a determination of the crowd rather than my own perspective. Looking for the crowd’s take, I took a poll in Twitter of the traders still around and the majority (46 percent) of those responding responded with their belief that the bull will not flag through the first quarter of 2022. Only 24 percent believed we would be facing a meaningful risk aversion. This projection seems to suit the probabilities based on the historical backdrop, but it also highlights a disparity that can cause problems via ‘potential’. While an extension of the prevailing trend may be more likely, the impact of an unexpected turn lower would exact a more severe impact on the markets.
Poll: What Do Expect from Risk Assets in Q1 2022
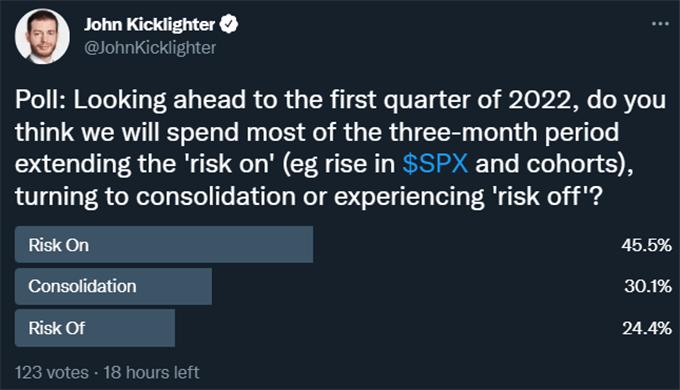
Poll from Twitter.com, @JohnKicklighter
Strong Seasonal Assumptions to Soothe the Bullish
For those that seek reassurance for a pre-determined bullish view through the open of the new year, they need look no further than the seasonality statistics for the S&P 500. Historically (back to 1900), the benchmark US index has averaged its best week of the entire calendar year through the first week of trade. Fundamentally-speaking, that would suit the expected re-investment actions that typically happen following year-end accounting rebalancing. Yet, where assumptions are the most engrained, the inevitable deviations can prove the most disruptive. There are certainly exceptions to the ‘opening week rally’ rule in history, and some have proven exceptionally volatile (2016, 2015, 2009, etc). Generally, I believe these markets demand more attention rather than less so that we can assess and respond as conditions require.
Average Weekly S&P 500 Performance by Calendar Week
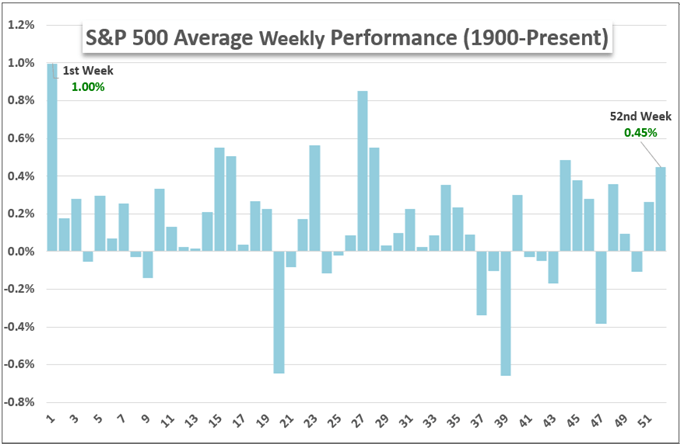
Chart Created by John Kicklighter with Data from S&P 500
Expanding the horizon beyond just the opening week of the year, the entire month of January tends to favor the bullish theme. A new year can translate into new opportunities for those that feel they missed out on the best of the previous 12-month stretch. That said, over the longer stretch of time, more systemic fundamental matters will come into perspective to play a critical role. Matters of growth, the resurgence in coronavirus cases and the shift in monetary policy trends will hold serious weight in investors’ minds – if not their conversations. For those that feel daunted by the task of keeping the pulse of the markets at large, I find the measures of volatility and volume/participation to be strong indicators of tidal changes rather than just noise. Both are presently very low – and not just for the time of year.
Average S&P 500 Performance, Volume and VIX Volatility by Calendar Month
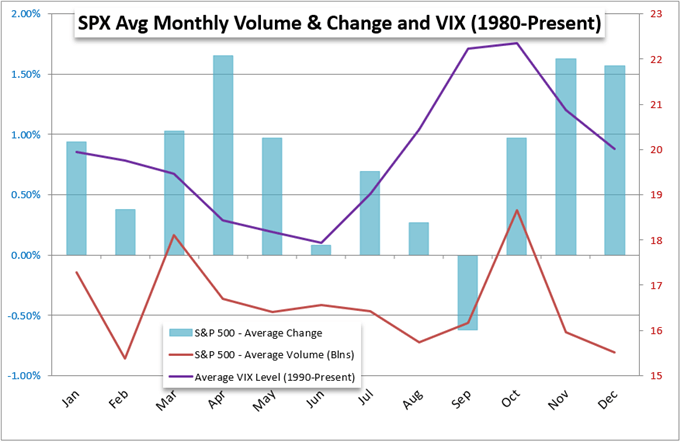
Chart Created by John Kicklighter with Data from S&P 500
The Major Fundamental Disruptors that Can Shake Us from a Collective Complacency
If we are in a ‘steadfast trend unless something unexpected befalls us’ situation, then it only makes sense that we dedicate time to consider the major probable disruptors that can upend the peaceful build up of speculative exposure. One of the more interesting catalysts of the recent past that has seen the market all but balk at its influence recently is the recent rise in the coronavirus cases. The worldwide daily number crossed the 1.7 million mark into the very end of the year, but the number of Covid-related deaths notably dropped to a 14-month low. The less deadly omicron variant has been treated by some as an actual boon to the market, but I would not put it in so optimistic a light. If governments decide to curb consumer mobility or trade owing to the virus, the impact will ultimately be detrimental. Another frequently overlooked matter without the favorable interpretation is the risk posed by China. Both the country’s internal growth prospects and the global implications from its financial troubles with property developers like Evergrande (who has missed multiple debt repayments to foreign investors) are very weighty prospects. Only the opaqueness of the country’s data has kept the market sanguine.
Worldwide Reports of Covid-Related Deaths (Daily)
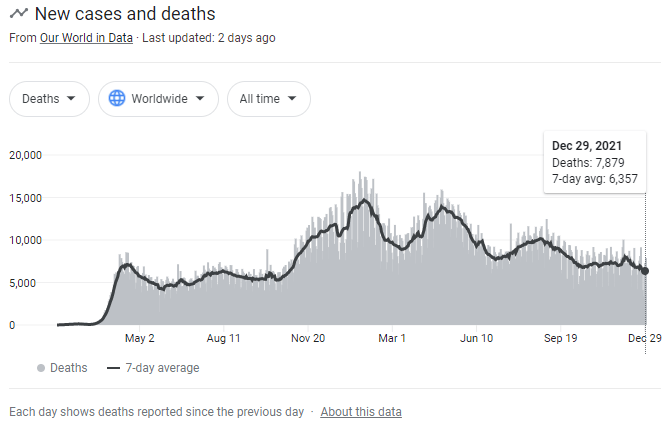
Chart from Google.com with Data from Multiple Sources
Another fundamental theme of great prominence for 2022 is the shift in global monetary policy. It isn’t an exaggeration to say that accommodative policies of the past decade (interest rates near zero and large-scale asset purchase programs) have played a major role in the market’s through today. Some may look at the size of the aggregate balance sheets of the major central banks and deem its correlation to benchmarks like the S&P 500 and say it is mere happenstance. I believe it to be a relationship of causation whereby the abundance of funds drove people to take on even greater risks to keep pace with ‘the market’. Backing out of this asset inflation is not going to be without incidence, but I still believe it to be necessary. Economies and markets that cannot function on their own are ultimately unhealthy. This carries serious global market implications, but in these early days, the start and stop among different policy groups likely represents strong individual currency (or regional asset) opportunities. I will definitely be watching the Dollar and EURUSD to start 2022 given it is in an extremely narrow 30-day range while volatility over the same period remains exceptionally high.

Chart of DXY with 100-SMA, US-German 10-Year, 30-Day ATR and Historical Range (Daily)
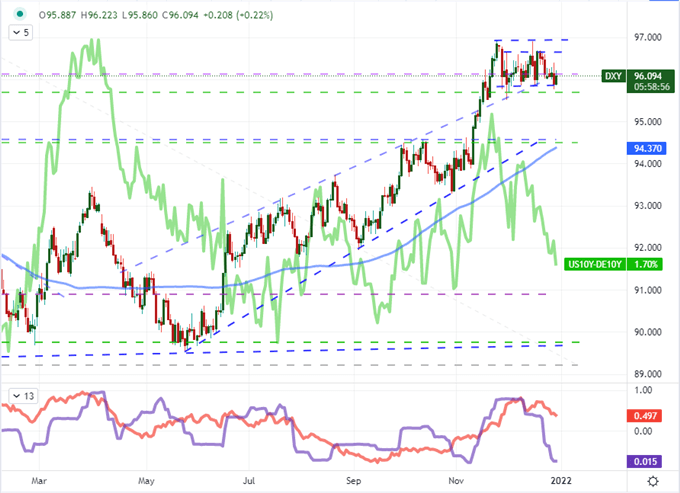
Chart Created on Tradingview Platform
New fundamental developments at this juncture are more likely to lead to a deviation from the complacency that has kept the markets bid. Given that perspective, I put the question of ‘grey swans’ (seemingly low probability but feasible events that can exact an extreme impact) to the people of Twitter. As you can see in the results, most believe the greatest thematic risk to the bull trend is unintended fallout from the Fed and other central banks’ efforts to withdrawal from the market. Do you agree?
Poll: The Most Likely ‘Grey Swan’ of Q1 2022
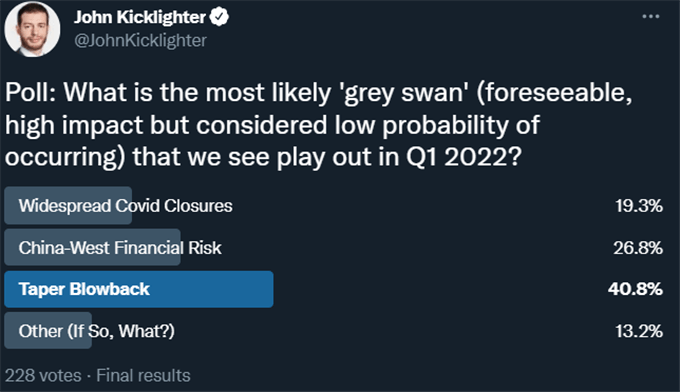
Poll from Twitter.com, @JohnKicklighter


