


SPDR S&P 500 ETF, Fed Decision, Yields, Dollar and VIX Talking Points
- A charge from the S&P 500 to just below its record high and an eventual slip from the Dollar would seem to indicate a ‘dovish’ shift from the Fed
- In reality, the US central bank accelerated its hawkish policy course further than the markets had anticipated by doubling the taper clip ($30 billion/month) and projecting three 2022 hikes
- The unusual market response in the immediate aftermath of the US rate decision should not bait us into apathy, there is a lot of event risk still ahead

What the Fed Did and How the Markets Responded
There are many technical traders out there that believe that price is the only measure that matters. I have a similar belief, but don’t fully subscribe to the notion that the neuroses of the crowd is necessarily a stable measure of conviction. Speculatively-driven markets are prone to our more base collective instincts, and there are plenty of irrational decisions in the logs of my previous trades. That said, how should we register the rally in ‘risk assets’ and the eventual slump from the US Dollar following what was arguably a hawkish turn from the Federal Reserve after its policy deliberation this past session? While there is serious discrepancy in performance for the range of speculative benchmarks I monitor, the supposedly close-to-the-action US indices registered a solid rally this past session. In fact, the S&P 500 rallied back up to 4,700 (470 for the SPDR ETF) on building momentum to toe the line of record range resistance. Is there enough fundamental weight, conviction and/or liquidity to usher us into a push through new record highs? I’m not skeptical of a tag of record highs, but I’ll maintain my incredulity around any trends this late in the year.
| Change in | Longs | Shorts | OI |
| Daily | 1% | -1% | 0% |
| Weekly | 15% | -13% | -1% |
Chart SPDR S&P 500 ETF with 20 and 100-Day SMAs with Volume (Daily)
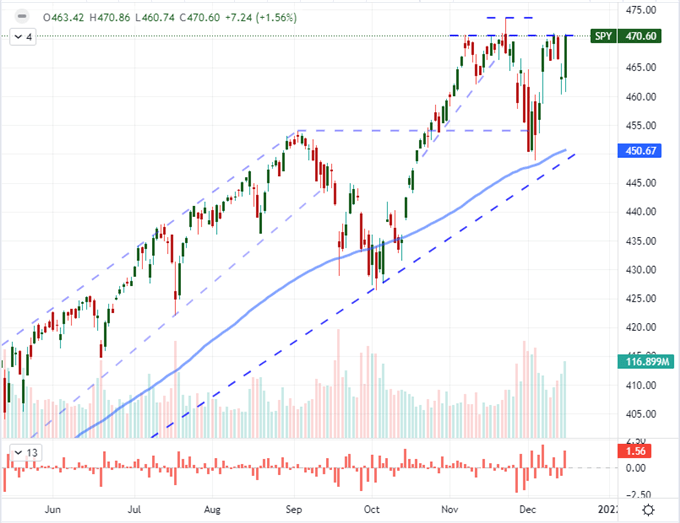
Chart Created on Tradingview Platform
If you are a price first (or only) trader, let’s look over the bearings the Federal Reserve offered up this past session. As expected, the Fed didn’t change its benchmark rate, but it would accelerate the time frame in the other important outlets for the meeting. The monetary policy statement announced a doubling of the tempo for the monthly taper ($15 to $30 billion) which would bring the end of the stimulus program to the end of March. Though an acceleration was expected, this still somewhat surprising. What was far more remarkable from the central bank’s communication deluge was the updated Summary of Economic Projections (SEP). There was a dip in growth forecasts, upgrade in the inflation outlook and drop in the jobless rate; but the most prominent change was the charge in the median 2022 rate forecasts from one full hike back in September to three hikes at this review. That is unabashedly hawkish as it both moves forward the start day for actual tightening and suggests an aggressive pace. It is this backdrop that makes the market’s restraint even more remarkable.
FOMC Rate Decision, Press Conference and SEP Scenario Table
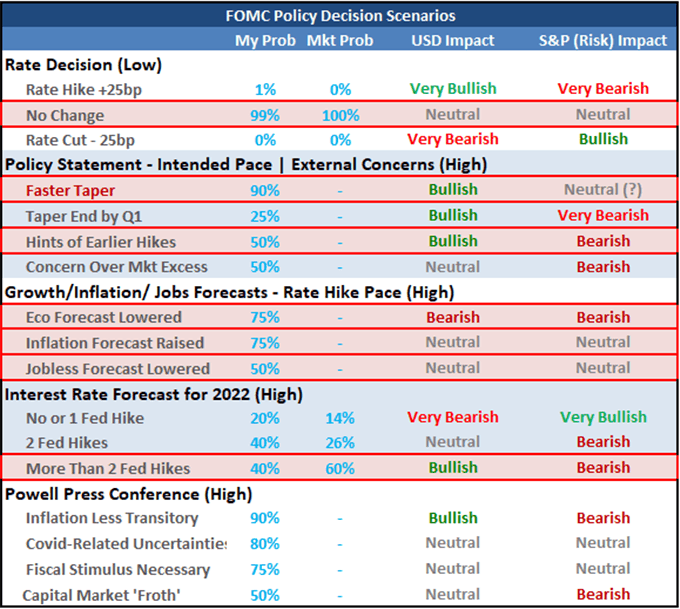
Chart Made by John Kicklighter with Data from Bloomberg
Fed Forecasts In the Charts
Up until Wednesday, the market was projecting a much more aggressive monetary policy pace for the Federal Reserve than the central bank itself seemed prepared to pursue. Through Tuesday, the market was pricing in full confidence of two full (25 basis point) rate hikes from the policy authority while its forecasts from three months ago suggested only a single increase was on tap. After this most recent SEP, we find the market is actually lagging the official consensus. That is not likely to last for very long. The market is notorious for leaning into rate forecasts – bullish or bearish – but global inflation is an unrelenting force. We will eventually see pressures abate, but the Fed has this past meeting made a materially hawkish shift in its stance. I believe the market-Fed gap will close over the coming days and weeks, but that may struggle to translate into meaningful movement for the Dollar and risk measures.
Chart of the Implied Rate Forecast for 2022 from Fed Funds Futures with 100-SMA (Daily)
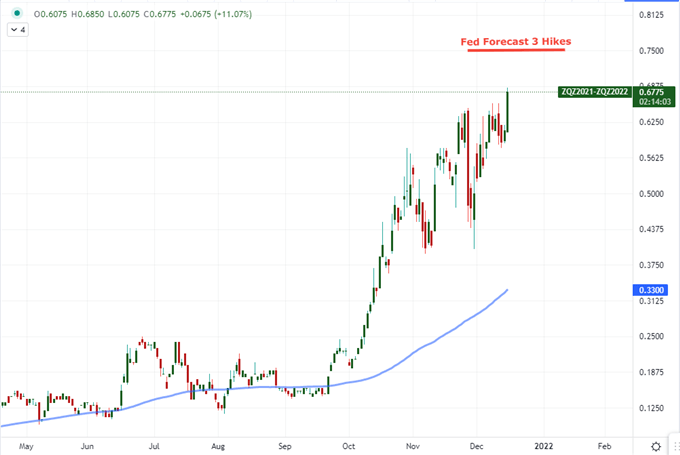
Chart Created on Tradingview Platform
As the rate forecast continues to rise – taking stocks with it or perhaps just getting out of the way of enthusiasm to bubble to the surface – there is a noticeably restraint registers for the US Dollar. When it comes to risk trends casting aside the implications of a rise in rate forecasts from the largest economy it the world, I can understand the deferred concern. However, to see the US Dollar having spent the last six months gaining ground on the back of its relative forward carry trade advantage fail to break higher after a clearly-hawkish turn from the world’s largest central bank, I am given pause. Is this just delayed market response or perhaps has the update been fully priced in for some time? I don’t’ think this matter has truly resolved in market terms and intend to watch the 97 to 96 range very closely through year’s end.
Chart of DXY Dollar Index with ‘Wicks’ Overlaid with the Implied 2022 Fed Fund Futures Outlook(Daily)
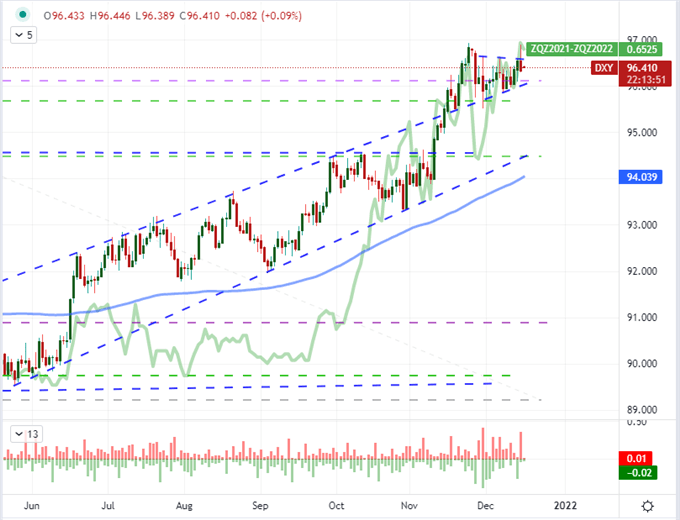
Chart Created on Tradingview Platform
The Push and Pull of What is Ahead
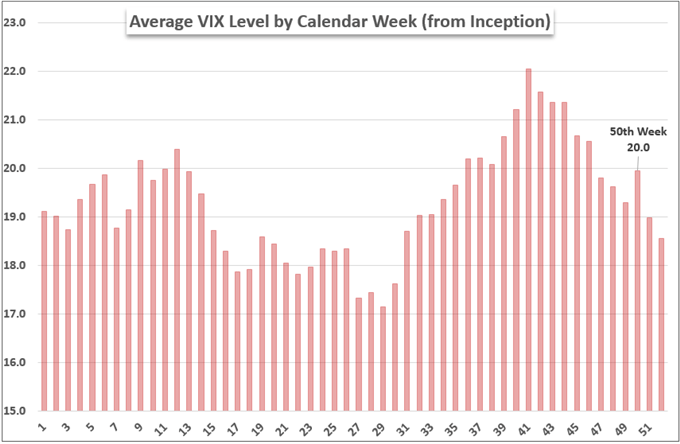
As we head into the back half of the trading week and the final few weeks of trade the year, it is important to gauge the influence of liquidity and volatility conditions alongside the scheduled event risk on tap. History shows that the 50th week of the year (which we are currently passing through) is a notable peak in an otherwise descending activity curve through the month of December. That explains some of the volatility registered this week, but it also insinuates that the subsequent two weeks could quickly drain conviction without an overriding fundamental thrust. I believe momentum will be severely impacted with conditions ahead, but that doesn’t mean that a bullish progress won’t be fostered during the lull. In fact, that is course that seasonality usually suggests.
Average Weekly VIX Performance by Calendar Week
Poll from Twitter.com, @JohnKicklighter
While we debate the seasonal norms of the market, it is also very important to monitor the high-profile event risk on tap to perhaps keep volatility elevated – or even push it even higher. Through this Asian session, we have seen New Zealand GDP beat expectations with a negative growth change update while the Australian PMIs start a run of December proxy growth updates from the developed world on a back footing. The 54.9 composite figure fell well short of the 55.7 reading anticipated. This matters because Thursday is bombarded by two themes: growth updates and Non-Fed central bank updates. For monetary policy there are a slew of central bank decisions due. The Bank of Japan (Friday) and Swiss National Bank are judged as ineffective and are anchored to their respective dovish lows. More interesting is the European Central Bank and Bank of England rate decisions. In particular, the BOE is interesting given the markets predisposition to speculate on the group’s intentions. If you want real volatility in forecasts and outcome, then watch the Mexican and Turkish central bank rate decisions due Thursday.
Calendar of Major Macro Economic Events
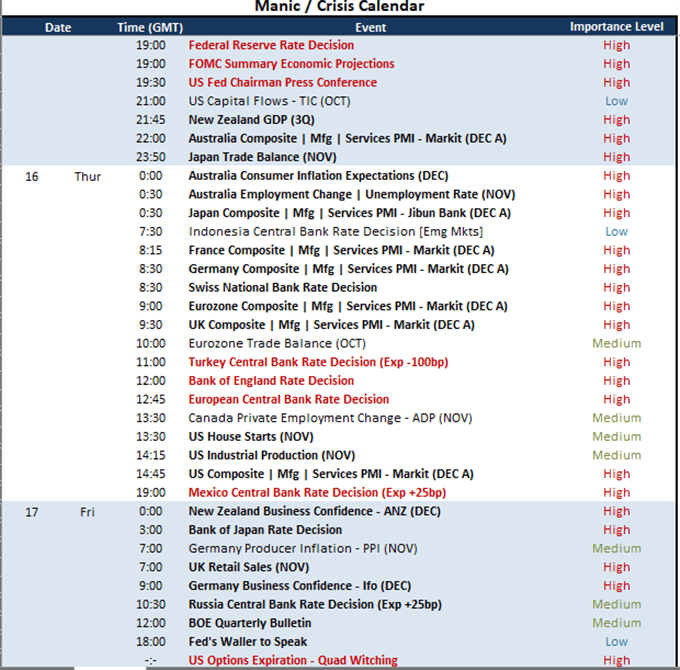
Calendar Made by John Kicklighter


