


S&P 500, Evergrande, USDCNH, Dollar, GBPUSD and USDJPY Talking Points
- The DXY Dollar Index has worked its way into a ‘terminal’ technical wedge with high-profile event risk capable of generating volatility ahead
- Risk assets in the S&P 500 and Nasdaq 100 face a high probability skewed response to the end-of-week data
- While seasonal liquidity conditions are waiting to drain the markets, traders would do well to monitor US debt ceiling relief, China’s Evergrande response and Russia-Ukraine tensions

Week-End Volatility Risk High as the Market Moves Onto Tangible Event Risk
We are heading into the final trading day of the week, ahead of a highly anticipated run of scheduled event risk centered on next Wednesday’s FOMC rate decision. Anticipation is a serious influence in the financial system, and it would be easy – perhaps ‘convenient’ – to detach through Friday’s session in observation of what could be high volatility ahead. That said, I don’t think the markets will simply succumb to an early fade into the weekend. We are facing loaded and exceptionally tight technical patterns on key benchmarks with a particularly prominent fundamental milestone on tap through this final trading session: the US CPI update. There is serious speculation surrounding this event and what it could imply for next week’s monetary policy meeting, which can create some unusual distortion from a measure like the US Dollar. However, for the S&P 500 and other risk assets, it may be difficult to generate a ‘relief’ rally on this data. Unless there is a serious easing in the data, the probability of a faster taper and earlier hike will persist. Given the proximity to record highs and generally top-heavy speculative-to-value stance of the markets, a retreat is a path of least resistance.
| Change in | Longs | Shorts | OI |
| Daily | 1% | -1% | 0% |
| Weekly | 15% | -13% | -1% |
Chart SPDR S&P 500 ETF with 100 and 200-Day SMAs with Volume (Daily)
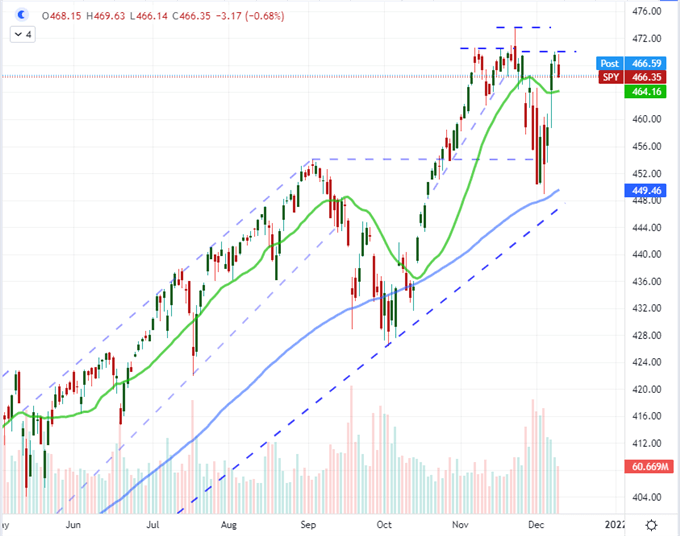
Chart Created on Tradingview Platform
Scheduled event represents a serious volatility flashpoint over the coming session, but it is important not to lose sight of the open-ended fundamental risks swirling in the background as they could readily take over the steering wheel with the proper provocation. The concern around the omicron variant of the coronavirus seems to have ebbed earlier this week to support the rally through the first half of the week, and the Senate’s passage of a bill to push back the US debt ceiling doesn’t seem to have meaningfully altered views of market appetite. Alternatively, the developments around reports that Russia is potentially staging another invasion into Ukraine are underpriced as a systemic threat. And, of course, the situation around China’s most indebted property developers has drawn limited attention – likely by design – and is certainly not discounted in the mainstream risk current.
Google Search Globally in Financial Queries for ‘Evergrande’, ‘Ukraine’, Omicron’ and ‘Fed’ (Daily)
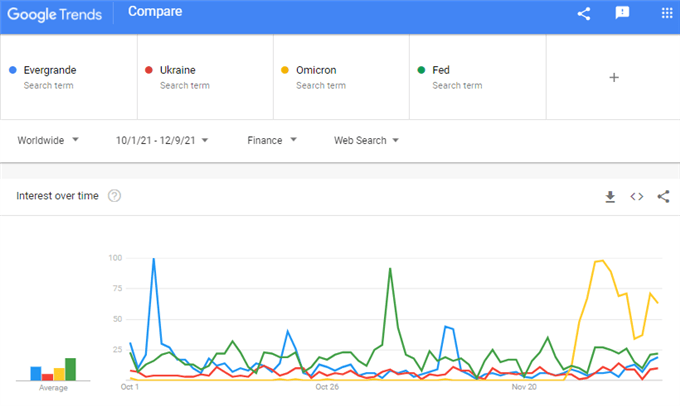
Chart from trends.google.com
While it is generally a good policy to develop strategy around probable and predictable fundamental events, it would be dangerous indeed to ignore the capricious risks that are visibly moving around the outskirts of our attention. The situation in China’s financial system remains one of my top concerns. Credit rating agency Fitch this past session moved property developers Evergrande and Kaisa v to ‘restricted default’ this past session, stating that the companies had clearly missed payments after grace periods closed. That said, this process is messy and far from binary in playing out – just look to how the Greek default played out. USDCNH did rebound from its unexpected bearish break Tuesday, but this exchange rate is still moving in an unusual cadence and general direction. The insight into the situation is disturbingly opaque by design, so serious problems are unlikely to be recognized until there is critical fallout. Beware the obscured risk.
Chart of USDCNH Overlaid with the CBOE China ETF Volatility Index (Daily)
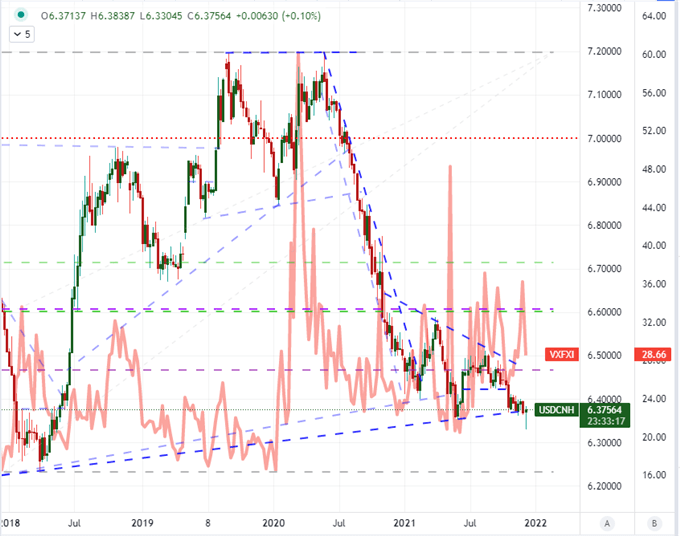
Chart Created on Tradingview Platform
Risk and Technical Patterns of a Known Quantity
In contrast to the ambiguity of USDCNH, the Dollar itself is pretty straightforward. There is what I consider to be a terminal technical wedge – meaning it will soon run out of room before a break is necessitated – and the presence of a high-profile event risk will likely contribute to a short-term, volatile resolution. The trade-weighted DXY Dollar Index is in a tight wedge that will very likely find a clearance of the 40 point (96.30 to 95.90) range before the week’s close. It is possible that we managed to hold within the tight congestion, but that would only move out the drama to the start of next week when the docket is very thin. The natural catalyst to resolve a break here is the US CPI release. There is an innate hawkish bias to this data and the Dollar has been on a bullish trajectory for some months. That means it may be easier to disappoint, which would imply greater potential if the break is a bearish one.
Chart of DXY with 50-Day Moving Average Overlaid by 2-Year Treasury Yield (Daily)
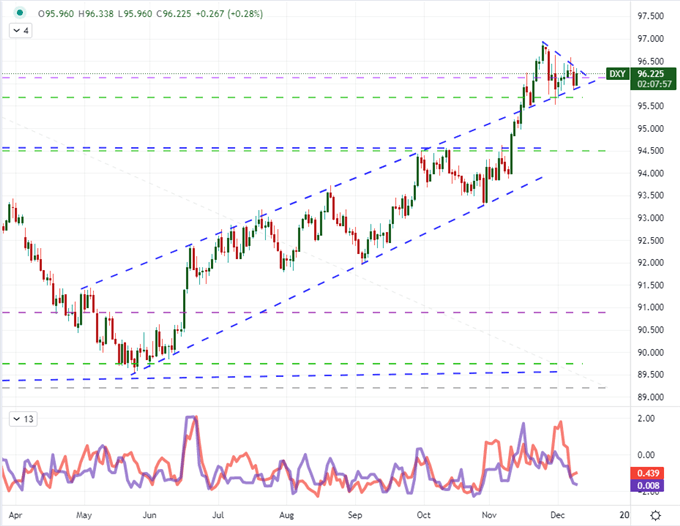
Chart Created on Tradingview Platform
From the inflation data itself, the BLS consumer price index is not the Fed’s preferred data, but it is the market’s favorite. That means it can carry significant financial market impact. The series is already exacting serious pressure on the sentiment and market expectations. The October update pushed three-decade highs for both headline and core inflation readings. This past session, President Joe Biden issued a statement to suggest the upcoming update will not reflect more recent reductions in gas prices, which suggests the White House expects – or has seen – even higher readings. These expectations are certainly baked into interest rate forecasts with Fed Fund futures and short-dated yield readings as high as they are. Despite the implications for more proximate rate hikes, this bias means there is more likely to be a meaningful move on a disappointment (Dollar retreat) than a hawkish/bullish impact.
Chart of US Headline and Core CPI Year-Over-Year Change (Monthly)
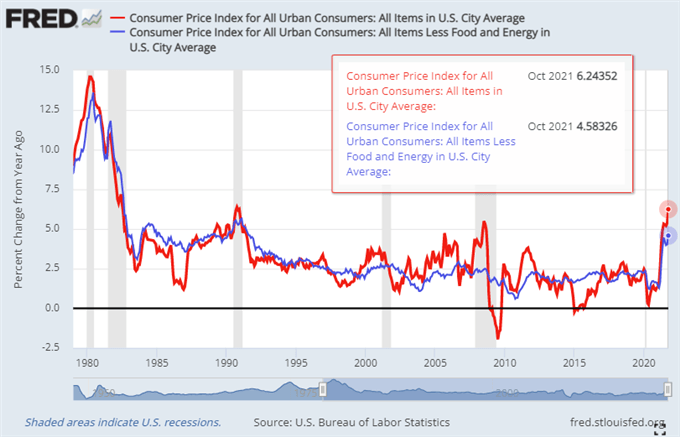
Chart Created on St. Louis Federal Reserve’s Economic Database
Choose Your Speculative Weapon
While I do work to establish the probability/potential scenarios heading into major event risk, I don’t ever presume an outcome or the crowd’s particular reaction. I like to have options for different eventualities. Should the Dollar slide because the data doesn’t live up to the already buoyant rate forecast, there are a number of crosses that look interesting. However, I’m particularly partial to GBPUSD breaking a tapering descending wedge to the upside at 1.3250. The BOE’s rate forecasts have been maintained at fairly aggressive levels as well, but the Sterling clearly has not benefit the perspective. The recent announcement of stay at home orders complicates the Pound’s situation, but data on tap Friday morning could clarify the short-term.
Chart GBPUSD (Daily)
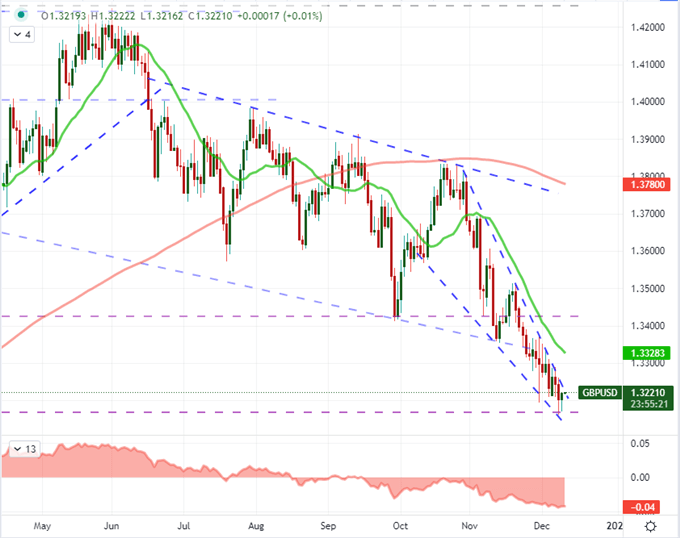
Chart Created on Tradingview Platform
Alternatively, the options for a Dollar bullish response are far less clear. Generally speaking, a hawkish response that motivates a Greenback rally would also likely hit risk assets in a negative way. That combination of influences could create an opportunity for the USD against emerging market currencies which are considered to be more risky. USDMXN, USDINR and USDBRL are worth contemplating with such a scenario. A more interesting (read: complicated) pair to consider would be USDJPY. I like this pair for a decisive outcome in either direction. If the data disappoints the Dollar but still keeps the pressure on risk assets for the Fed next week, that would double up on the pressure to the downside towards the head-and-shoulders neckline around 112.50/25. Alternatively, a strong Dollar response that doesn’t send the S&P 500 reeling could help push us to and above 1140 so long as liquidity holds out for the week.
Chart USDJPY with 100-Day SMA (Daily)
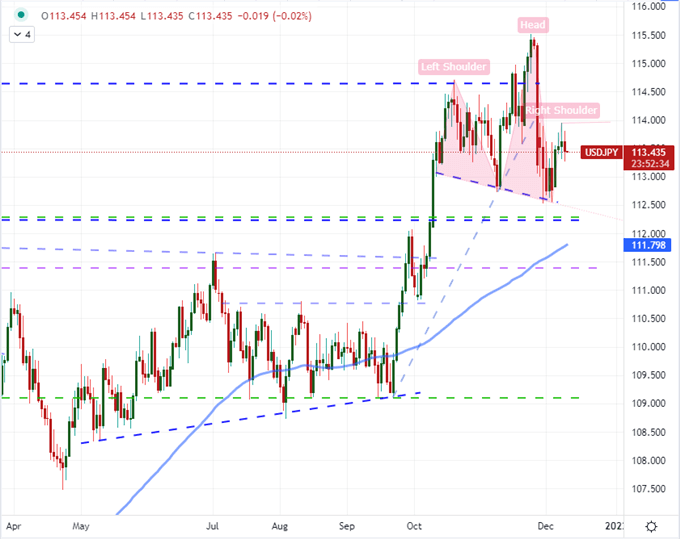
Chart Created on Tradingview Platform


