


Dow, Nasdaq 100, S&P 500, Dollar and NFPs Talking Points
- Following Wednesday’s broad risk tumble, the Dow, S&P 500 and Nasdaq put in for a stiff bounce this past session
- Volatility is the dangerous undercurrent that persists, so a steady course through the final day of trade this week could go far towards restoring ‘seasonal’ norms
- Top event risk from a headlines perspective Friday is the November NFPs, but I place greater weight on the ISM services update as the yield curve slides

A Speculative Check Before Market’s Commit to a Collapse
We were on the verge of a much more critical technical reversal among the US indices through Wednesday’s close, but the pressure noticeably eased this past session. A rebound from the Dow, S&P 500 and Nasdaq 100 matches a broader bounce in so-called ‘risk’ assets which throttles back the sense of urgency around a systemic reversal at a very inopportune time of the year. There remains a serious threat to a peaceful slide into the close of 2021; but if we can hold fast through the close of this week, the probability of seasonal reversion (which favors bullish interests and a crush in volatility) will rise significantly. For now, there are convenient technical lines in the sand. The Dow Jones Industrial Average has the 34,000 trendline support that we checked higher from this past session. It is worth noting that the value index posted the biggest advance among its top peers this past session – a 1.8 percent rally that was the biggest single-day jump in 9 months. That bigger bounce shows favor among investors for an index that slid earlier and further.
| Change in | Longs | Shorts | OI |
| Daily | -18% | 18% | 7% |
| Weekly | -19% | 14% | 4% |
Chart of Dow Jones Industrial Average with 200-Day SMA, 1-Day ROC and 5-Day ATR (Daily)
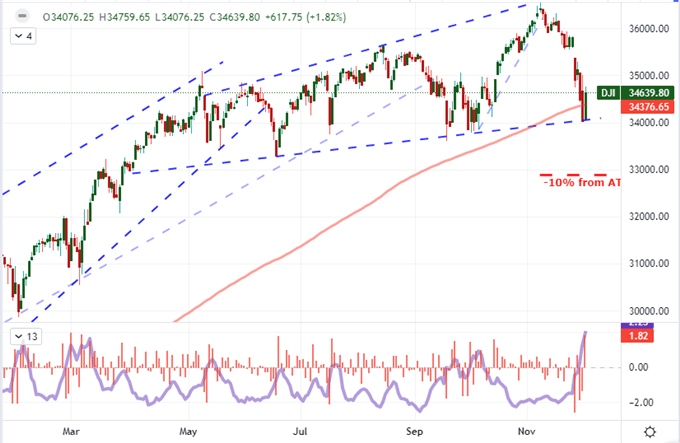
Chart Created on Tradingview Platform
Another technical milestone that I think is worthy of pointing out for the Dow is that its jump from a deeper retracement has pushed it back above the 200-day moving average. The index dropped below this long-term moving trend for the first time in 350 trading days the previous session which is quite the milestone. We have seen previous such developments in the past where the flip didn’t mark the escalation of a deeper bear trend. However, the event still carries serious technical weight. If we get back below the moving average and subsequently take out 34,000, beware the market’s assessment of the situation.
Chart Dow Jones Industrial Average with 200-Day SMA and Consecutive Days Above and Below (Daily)
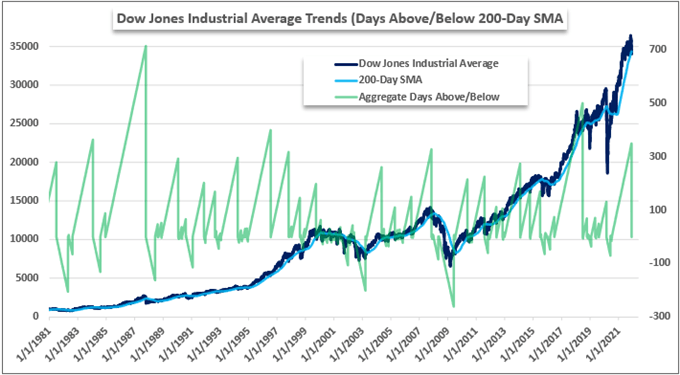
Chart Created by John Kicklighter with Data from Bloomberg
While we are still some ways from entering a technical correction from the major US indices (defined as a 10 percent correction from highs), there is a heightened focus around the bearings of these speculative benchmarks. That is the downside of leading ‘risk appetite’ during favorable times: the consistency will leverage a sense of bottomless support which amplifies the concern around any modestly unfavorable developments. The Dow is generally the least tied to the identify of representing a relentless ‘risk on’ perspective. The Nasdaq 100, on the other hand, has taken up the call as the peak of speculative intent as top market cap tech firms took over from crypto and meme stocks from earlier in the year. For that reason, I will be watching to see if the head-and-shoulders pattern on this index can be neutralized Friday or whether we further slide 15,750 on the way to 15,000.
Chart of Nasdaq 100 with 50-Day Moving Average (Daily)
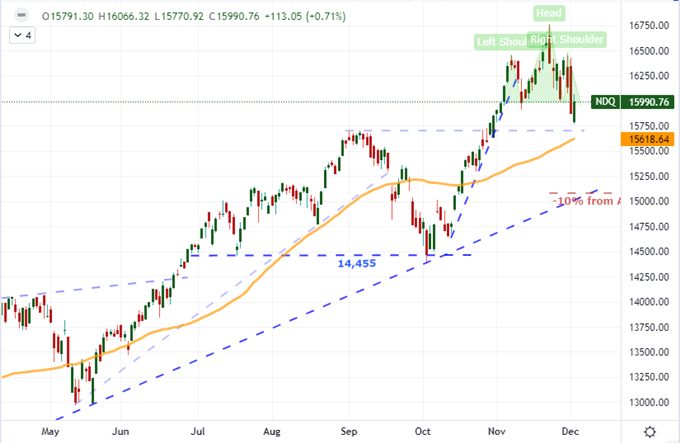
Chart Created on Tradingview Platform
The Ability to Tip the Balance Back to Seasonal Assumptions
As we move into the final trading day of the first week (not full week) of December, there is something of a fork in the rode. If the volatility of the past five days that has pushed the VIX above 30 Wednesday persists, the probability of a more systemic bear trend development that overrides the expectation of thin liquidity conditions through the end of the year will rise. Alternatively, if we see a further rebound in the US indices through week’s end, it could help settle the fears of an unseasonable sentiment turn. Yet, what would really level out my expectations for possible extreme market conditions spurred by random fundamental headlines (omicron, Fed forecasts, growth slowing, etc) is a moderation of volatility. A sharp reduction in gaps, daily ranges and intraday reversals would go a long way to settling frayed nerves.
Chart of S&P 500 Monthly Performance, Volume and Volatility
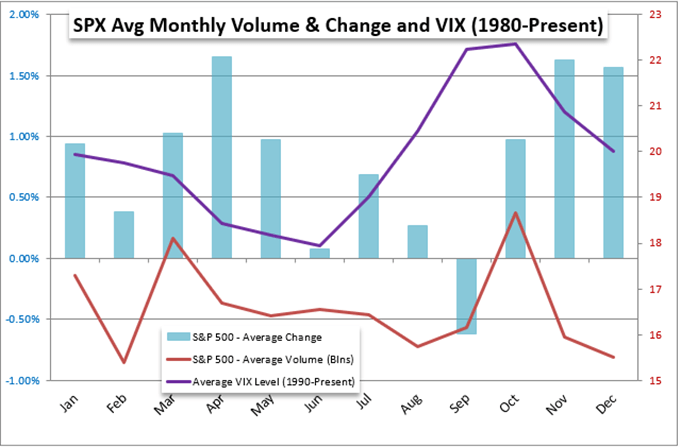
Chart Created on John Kicklighter with Data from Bloomberg
While I do think a natural moderation is the most likely course to expect through the close of this week, it is important to keep an open mind to the alternative. Generally, I am of the belief that these markets are long overdue for a market correction to account for traditional measures of value. Yet, those adjustments more often play out during liquid times. Of course, there are always exception to the rule. The Friday nonfarm payrolls (NFPs) represents a highly recognizable event capable of generating a remarkable about of volatility. It remains as capable as ever to upend the market owing to the aggressive rate expectations. In fact, despite the volatility and drift towards risk aversion recently, rate forecasts in 2-year Treasury yields and derived from Fed Funds futures remain remarkably firm. That is a boon for the Dollar as it plays more the role of a carry currency than safe haven at the moment.
Chart of DXY Dollar Index and US 2-Year Treasury Yield with 20-Day Correlation (Daily)
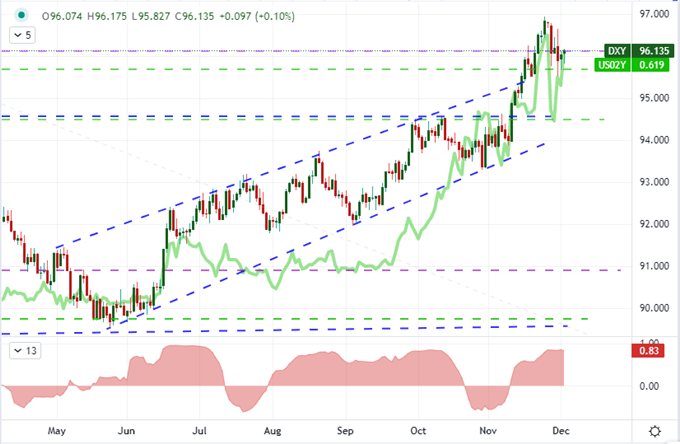
Chart Created on Tradingview Platform
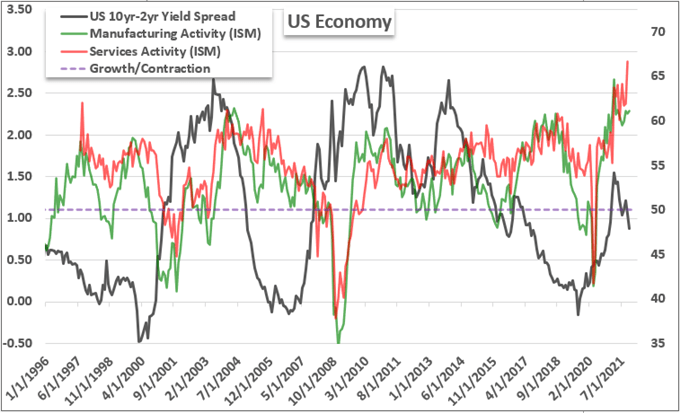
If the employment statistics meaningfully outperform expectations and push rate expectations even further – and they are set very high with the likes of Atlanta Fed President Bostic saying he supports a Q1 end to taper and possibly earlier rate hike – it could very well have a negative impact on risk assets. That would be a quandary given that higher rates tend to pull risk appetite lower. This will be an interesting issue for the likes of the Dollar and really complicated for USDJPY (two ‘safe havens’) and USDCAD (as there is Canadian jobs data at the same time). A more direct fundamental bead – that will draw less headline interest – is the ISM service sector activity report. A much better reflection of the US economy, this reading pushed to a series high the previous month; and the market’s growth measure in the 2/10 Treasury yield spread suggests growth and rates are starting to find conflict.
Calendar of Major Macro Event Risk Through Week End
Calendar Created by John Kicklighter


