


S&P 500, Best Buy, Nasdaq 100, Dollar and USDJPY Talking Points
- The S&P 500 opened the week to a gap higher on a ‘terminal’ rising wedge, but there was little support to keep the break running; and instead, the index tipped into reversal
- News that US President Biden had decided to keep Jerome Powell at the head of the Fed proved a boon for the US Dollar as it extended its run to fresh 16-month highs
- Interest rate speculation will remain an active theme in the days ahead, but Best Buy earnings and November PMIs will attempt to carry the ball as holiday trading approaches

A False Breakout Reversal
We were heading into a ‘break of necessity’ for the S&P 500, so a technical resolution was inevitably (horizontal resistance and rising support would eventually cross). Yet, that doesn’t mean that a break would have to find meaningful follow through. In fact, considering that we are facing a holiday liquidity crunch in the second half of this week, the burden for a full-blown trend would be set particularly high. Therefore, though there may have been a favorable wind to speculative bulls’ backs heading into this week, an added shove from the news that the Fed Chairman Jerome Powell would remain the head of a slowly normalizing central bank wouldn’t exactly spell the successful navigation of an extended bull run. We could see that recognition dawn on the masses this session when in the progression of the SPX’s session. The benchmark gapped on the open to a record high while much of the day meandered in thin air. As the session was winding down, recognition of exposure led to a swift reversal that resulted in ‘false breakout, reversal’ pattern that left the larger ‘upper wick’ in 8 months and ultimately a close below the same pattern’s support. Now…can we find follow through for the bears?
| Change in | Longs | Shorts | OI |
| Daily | 1% | -1% | 0% |
| Weekly | 15% | -13% | -1% |
Chart of S&P 500 with 20-Day SMA, 5-Day Historical Range and Daily Wicks (Daily)
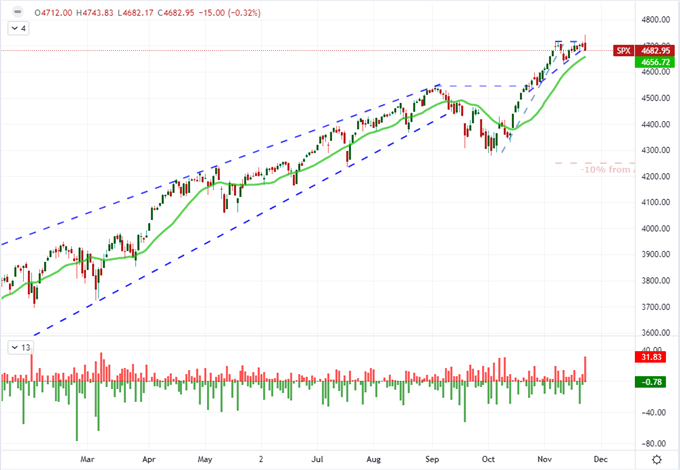
Chart Created on Tradingview Platform
In evaluating this about face in the US indices, the context of the broader market suggests that an outlier is ultimately converging on the broader ‘risk’ market. Notably these past few weeks, there has been a steady congestion or slow retreat from the global indices, emerging market assets, junk bonds, carry trade and even inflation-inflated commodities. There has been a distinct appetite for short-term opportunism whereby momentum is the market’s most prized feature. Without a more robust fundamental backing, this run would also find itself exposed to scrutiny and rebalancing. Naturally, when there is an effort to take some excessive exposure off the table, it would begin with the most stretched areas. The Nasdaq 100 to Dow Jones Industrial Average ratio would show that tentative slip, pulling back from its highest levels since the Dot-com peak back in March 2000. A more targeted area of indulgence to monitor this form of appetite is the meme stock favorites. Particularly, Best Buy earnings are due before the open Tuesday; and the stock has been on an incredibly persistent climb these past few months.
Chart of Best Buy Overlaid with Nasdaq-to-Dow Ratio (Daily)
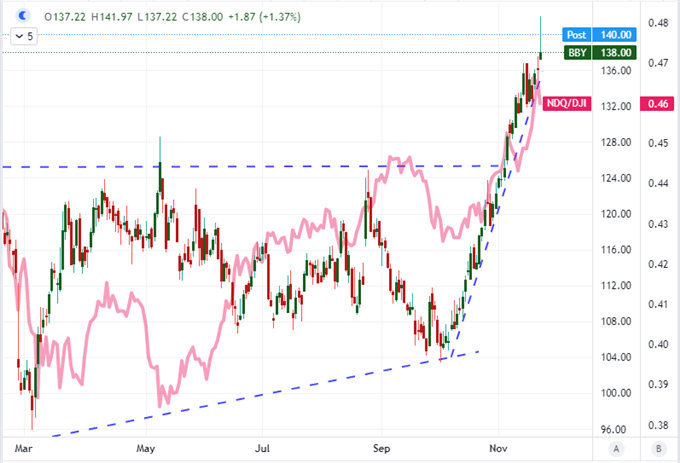
Chart Created on Tradingview Platform
However, as we weigh out our expectations for earnings and short-term speculative rebalancing; it is important to remember the liquidity path and statistical norms of the past. Wednesday evening (New York session) will most likely see a rapid decline in market depth which will significantly distort price action through the back half of the week. Rather than fully crush volatility, it will likely make any flare ups more acute but significantly shorter lived. In the lead up to that flip, market participants will need to determine how comfortable they are holding their exposure – wherever it may be. I feel the markets are more stretched in a long US capital markets position more than anything else.
Chart of S&P 500 Weekly Historical Performance
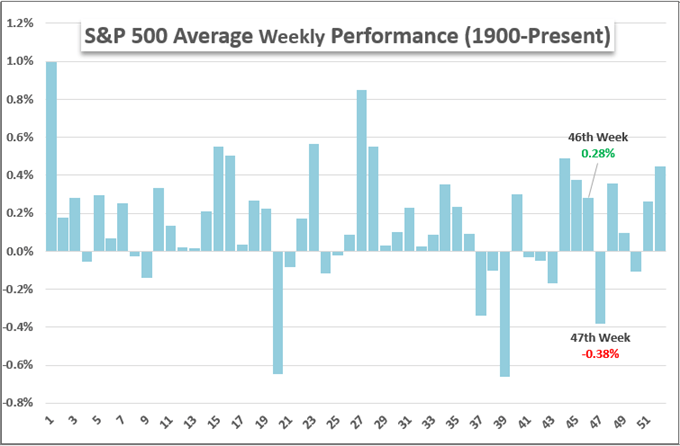
Chart Created on John Kicklighter with Data from S&P
Status Quo for the Fed is Dollar Fuel
The top news to start the week was President Biden’s decision between Jerome Powell or Lael Brainard to head up the Fed for the next four years. It was suggested the decision was due sometime before Thanksgiving, but the President made the determination promptly at 9 AM Washington DC time. Had Brainard received the nod, it would have likely charged what latent speculative appetite was still on the sidelines. However, the leadership structure was left unchanged and the slow and methodical progress towards normalizing the extreme post-pandemic stimulus effort would continue. This offers no tangible benefit to stretched capital market assets, but it does offer relief to fears on hawkish rate forecasts. We saw the relief play out with the US 2 year Treasury yield rally 15 percent to 0.59 percent while Fed Fund futures implied rate tightening through 2022 jumped to price 62 bps worth of hikes over the coming year. In turn, the Dollar would rally through the midpoint of its 2020-2022 range; but that is an uneven technical progress among the crosses.
Chart of DXY Dollar Index Overlaid with Implied Rate Forecast for 2022 from Fed Fund Futures (Daily)
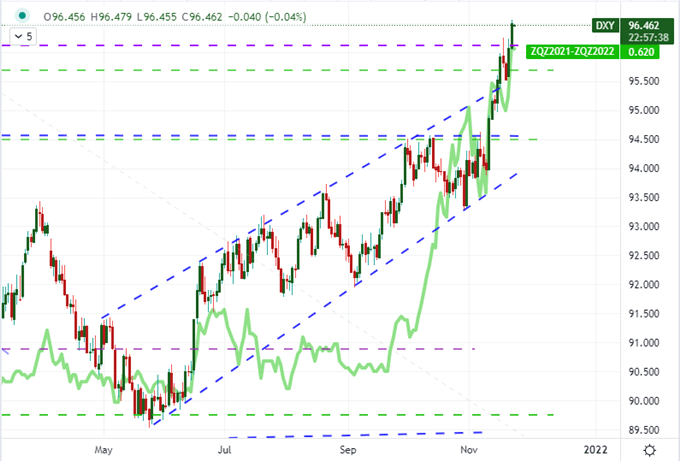
Chart Created on Tradingview Platform
Ultimately, in positioning the Dollar’s strength against major counterparts, it is best served to contrast to an overtly dovish counterpart. ECB President Christine Lagarde has recently been on a roadshow to suppress emergent 2022 rate hike expectations which makes for a very distinct contrast for EURUSD sliding towards 1.1300. It would seem by this count that USDJPY is in a similar position given that the Japanese Yen is in no position to see rates rise anywhere on the foreseeable horizon. However, there is a caveat: Yen crosses are sensitive to risk trends. While the Dollar was supported for a rate-based rally, there was a pullback in risk-leaning assets like carry trade. Ultimately, yield differentials still carry a stronger 10-day correlation to USDJPY, but there are better options for clarity when staking out fundamental options.
Chart of USDJPY Overlaid with the US–Japan 10-Year Yield Spread and 10-Day Correlations (Daily)
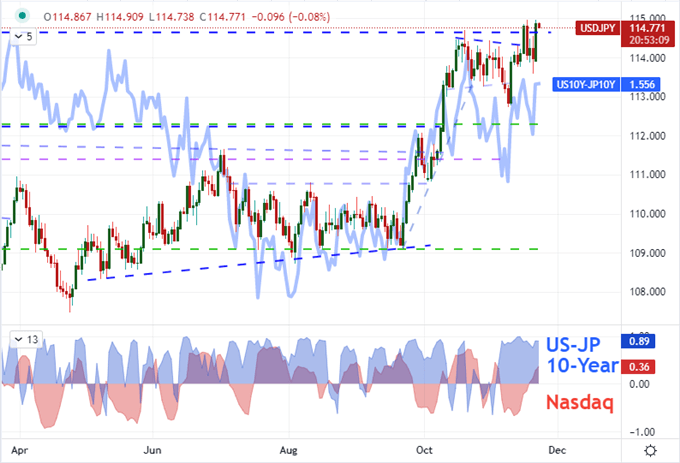
Chart Created on Tradingview Platform
The ‘Other’ Fundamental Themes that We Need to Track
Looking out over the next 48 hours of trading, there is a meaningful run of scheduled event risk before the liquidity drains from the system. The question is how much market moving potential there is in this run. I suspect there is some discrete volatility potential from the likes of earnings data, developed world PMIs and certainly Wednesday’s favorite Fed inflation update; but that doesn’t naturally line up to productive trend development. An important part of trading is to fit your strategy and opportunities to market conditions.
Calendar of Major Macro Event Risk Friday and Early Next Week
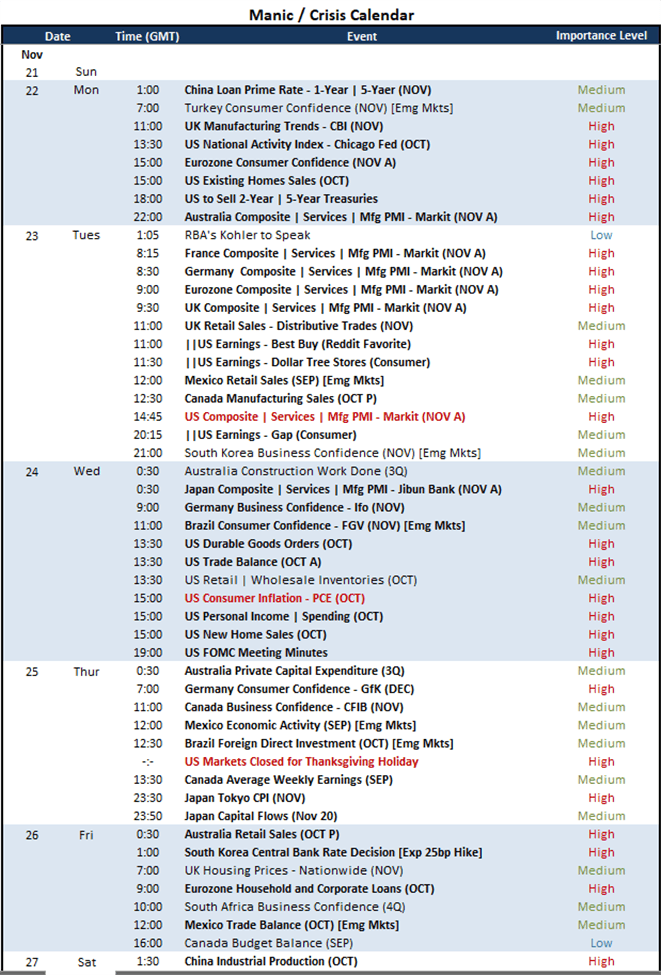
Calendar Created by John Kicklighter
Thematically, the more reliable fundamental theme over the coming session is the perspective of growth through the current month. While I believe interest rate speculation is the more capable driver, there isn’t much in the way of scheduled event risk to definitively alter the market’s tides. Of course, it pays to keep your ear to the ground and your eyes on the headlines for the unexpected. In the meantime, the November PMIs from major developed economies (US, UK, Eurozone, UK, Japan and Australia) will offer a critical update on economic tempo amid policy shifting, holiday spending trends and changing Covid policies. If there is an abrupt change – for better or worse – the market will react.
Chart of Major Economies’ Composite PMIs (Monthly)
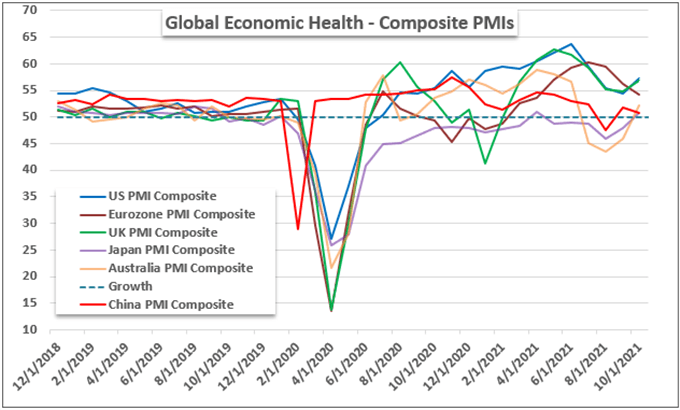
Chart Created by John Kicklighter with Data from IHS Markit
More in the abstract, but definitely a proven market mover, is the ongoing risk that Covid represents to the system. While most countries are trying to move away from the economic crunch from lockdown policies, we have seen another rise in the worldwide cases of the virus (the fifth such wave) which is finding records in certain economies. The situation is most acute in Europe where Austria has announced another lockdown amid record numbers; but thus far, Eurozone economic engine Germany has avoided this solution. Protests, however, are rising as despair once again takes hold.
Chart of New Covid Cases in Germany (Daily)
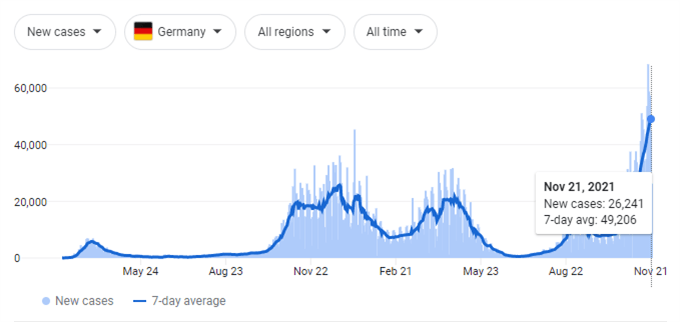
Chart from Google.com with Data from an Aggregate of Sources


