


S&P 500, Walmart, Baidu, EURUSD, USDJPY and GBPCAD Talking Points
- The S&P 500 and Nasdaq 100 closed out this past session marginally lower than their respective record high markets – doing a disservice to the ‘buy the dip’ and FOMO mentalities
- Backed by inflation and burgeoning interest rate forecasts, the Dollar continued its climb; but it was more than just the EURUSD making an impression
- Earnings will once again play a role on the fundamental board ahead along with inflation data and a simmering concern/interest over risk trends

The S&P 500 Once Again Flirts With Record Highs Without Committing
Once again, the proximity to a record high isn’t spurring enough speculative charge to simply put the bulls over the top. That is a disappointing sign for a market that seems to be operating on the ‘buy the dip’ or ‘fear of missing out’ principal – and which is clearly struggling with a starkly uneven performance across speculative assets. For its part, the US indices market is loitering close to record highs last established Monday, November 8th. The S&P 500 was closest to establishing a new high-water mark with a close that was less than one point off last Monday’s print. However, as close as we may seem to a breakout in enthusiasm here, there is a distinctly disparate picture across other ‘risk’ measures. Emerging market, high yield and carry assets – all arguably more sensitive to a yield-backed sentiment view – were struggling substantially off their respective highs. The appetite for momentum over value seems to be well established with the Nasdaq 100’s strength relative to the Dow up this past session while the S&P 500’s performance compared to the ‘rest of world’ equities (VEU ETF) closed at a fresh record high.
| Change in | Longs | Shorts | OI |
| Daily | 1% | -1% | 0% |
| Weekly | 15% | -13% | -1% |
Chart of S&P 500 with 20-Day SMA (Daily)
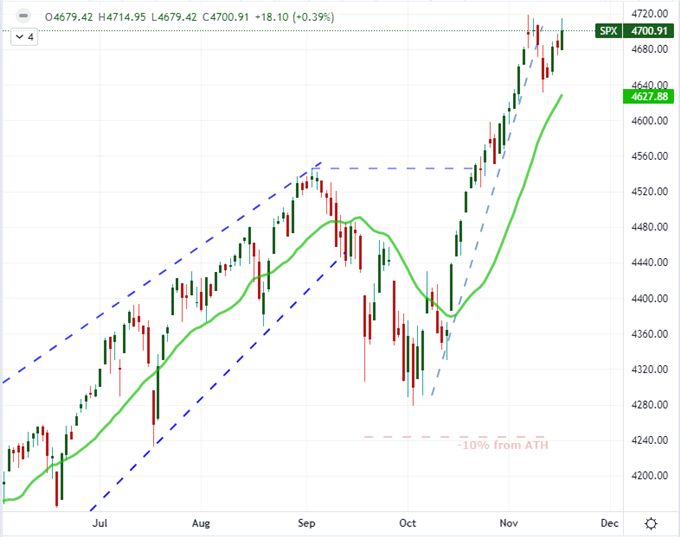
Chart Created on Tradingview Platform
Another perspective of the risk backdrop is the ongoing earnings deluge. We are in the final days of the 3Q corporate reporting period, but the consumer giants announcing their numbers offer important reflection on general economic health, inflation pressures and the supply chain. This past session, Walmart beat expectations with a $1.45 EPS (earnings per share) that bested expectations of $1.40 on revenues that grew by 4.3 percent to $140.5 billion. Further, the company upgraded its forecasts, said that performance for its grocery further improved and said that its size was helping it to overcome supply chain disruption. Despite all of this, WMT shares dropped. Coming up, the earnings calendar offers up Target, Lowe’s and Baidu. I’m particularly interested in the Chinese e-commerce giant as a contrast to Walmart. Theoretically-speaking, the WMT-BIDU ratio should track generally with the USDCNH – for which many remain reasonably dubious of its free-market standing. Perhaps this can offer a better proxy on how to gauge Chinese growth relative to the US.
Chart of Walmart to Baidu Ratio Overlaid with USDCNH Exchange Rate (Weekly)
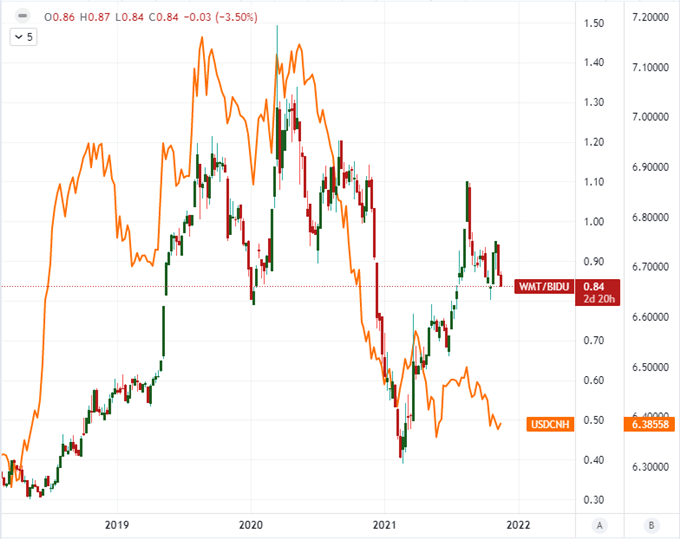
Chart Created on Tradingview Platform
Inflation, Interest Rates and the Dollar
With 48 hours of the trading week behind us, we still seem to be lacking a strong fundamental driver. If anything, inflation seems to still hold the torch; but its charge isn’t systemic enough to unseat the complacent bid in risk assets. Between corporate earnings warnings and import inflation (which grew 1.2 percent on the month and 10.7 percent year-over-year), the Dollar seems the focal point of price pressures. This past session St Louis Fed President James Bullard reiterated his believe that he agreed with the market’s two rate hike forecast and suggested that the balance sheet run off can happen more quickly. Fed hikes for 2022 implied from Fed Fund futures held the forecast at 56 basis points of tightening while the probability of a June 15, 2022 hike on the CME’s FedWatch tool held at 68 percent. All of that said, the Dollar’s hawkish outlook continues to contrast distinctly to the Euro’s dovish position. The 5-day rate of change on EURUSD is the most bearish since April 2020 and is the third most aggressive run lower in five years.
Chart of EURUSD with 100-Day SMA and 5-Day Rate of Change (Daily)
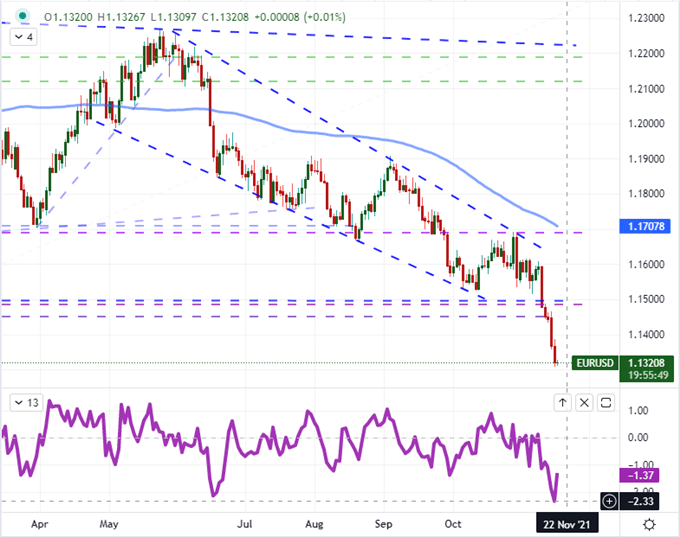
Chart Created on Tradingview Platform
It is atypical when EURUSD leads the way for momentum considering the weight of its liquidity. That said, at least the Greenback was registering more purchase relative to its major counterparts this past session. With the notable exception of GBPUSD, the USD was gaining. Yet, of these moves (EURUSD included) none were more historically remarkable than USDJPY. Last week’s rebound from a false breakdown transitioned into an outright bullish bearing on a break through 114.50. That is the highest market for this pair in four-and-a-half years. Typically, I would point out that this pair is notorious for its struggle to extend trend, but the Fed-BOJ contrast is real.
Chart of USDJPY with 100-Week SMA (Weekly)
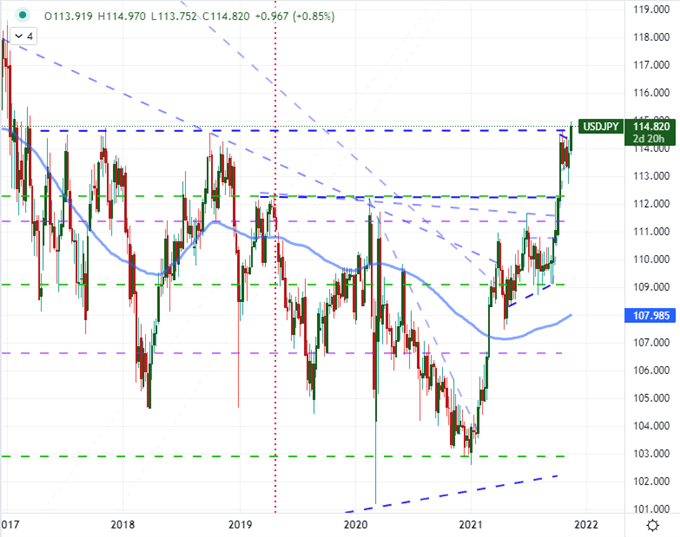
Chart Created on Tradingview Platform
What to Watch for On Thursday
There is notable scheduled event on the economic calendar immediately ahead of us, but it is important to keep track of the heavy-hitting thematic. Risk appetite is perhaps more abstract in nature, but it is the most capable and overriding theme that can take over. The topical inflation concern can have both a growth and monetary policy perspective that circles back around to sentiment. On the docket, the aforementioned earnings releases will be joined by a couple of inflation reports along with perspective of financial stability (from the ECB’s report and Fed Mester’s conference remarks) and a wide run of Fed remarks.
Calendar of Major Macro Event Risk for the Week
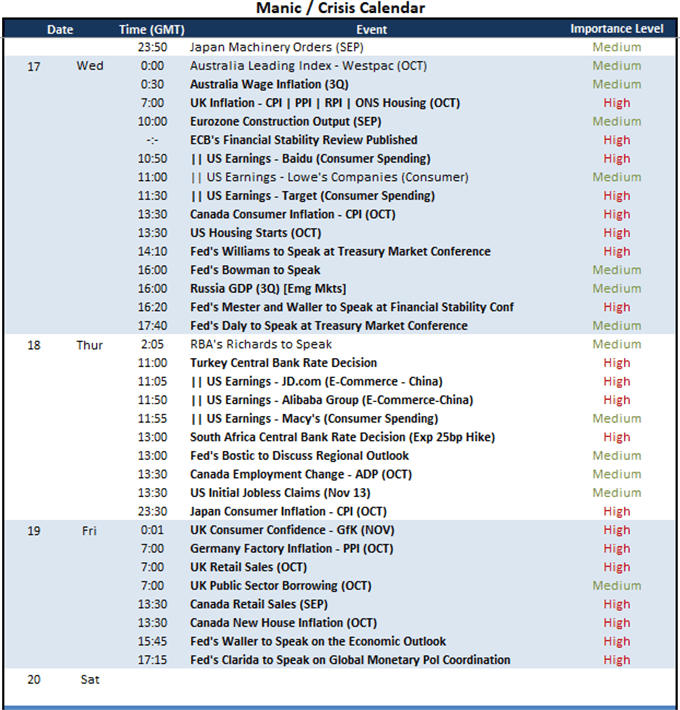
Calendar Created by John Kicklighter
Of the two inflation data runs through the coming session, the UK’s consumer, retail, producer and housing price measures are arguably the most comprehensive. Price pressures are expected to accelerate and the Sterling has held its own over the past few days, but you have to remember the view from the market after the Bank of England’s (BOE) recent announcement. The group decided to hold rates against speculation of the first hike of the cycle. This could leave the Pound in a better position to ‘beat’ expectations if the data prints favorably. As for pairs to monitor, EURGBP really exacerbates the relative monetary policy views while a break of or reversal from 0.8400 seems a practical pivot level.
Chart of EURGBP with 200-Day SMA and 5-Day Rate of Change (Daily)
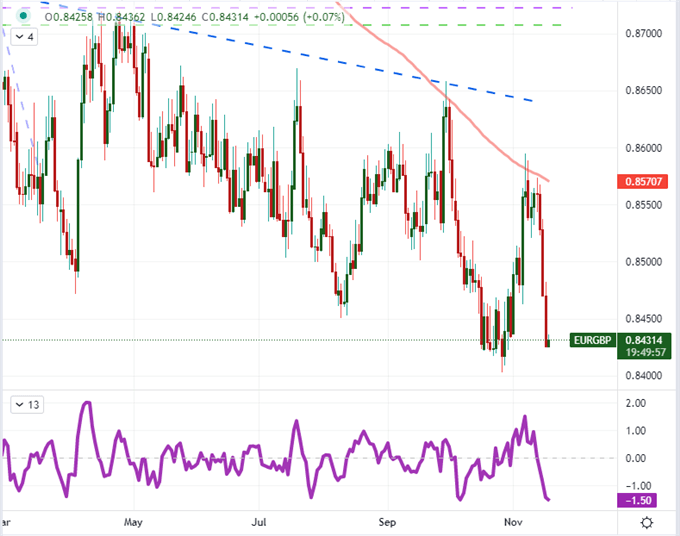
Chart Created on Tradingview Platform
The United Kingdom isn’t the only country due to report inflation statistics ahead. Canadian consumer price measures will also cater to an active speculative backdrop. The Bank of Canada has already moved to taper with the market readily pricing in rate hike time tables. GBPCAD is arguably the most impractical cross to consider for the next 24 hours – as anything other than a clear bullish view for one and bearish for the other – will lead to some level of conflict and confusion for the cross. That said, the false down and inverse head-and-shoulder picture from the pair make for a compelling technical picture.
Chart of GBPCAD with 20-Day SMA (Daily)
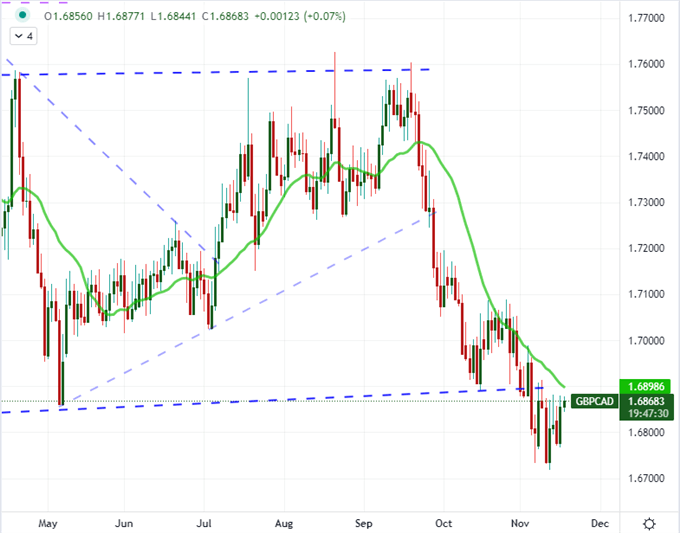
Chart Created on Tradingview Platform


