


Dow, Tesla, EURUSD, Dollar, Walmart and Inflation Talking Points
- Not only have US indices struggled for fresh traction to start the new trading week, but the Dow is building pressure with lowest 20-day ATR (volatility) since Dec 2019
- EURUSD, on the other hand, has posted a critical break below 1.1400; but there is reason to be cautious on the anticipated follow through
- Inflation remains my primary fundamental focus moving forward, and that stir as much interest in WMT and HD earnings as US import inflation and Fed rate forecasts

The Rebound in Risk Appetite Peters Out at Week’s Open
Inflation is still the market’s top fundamental guiding light, but that doesn’t mean the theme is always under power…not even when the EURUSD extends its slide to a fresh 16-month low. Neither the charge from last week’s heady price readings (US CPI update hit a three decade high) nor fresh headlines including President Biden’s signing the $1 trillion infrastructure bill into law seemed to rouse the broader capital markets through the opening session of trade. Through Monday’s close, the S&P 500 was essentially unmoved from the Friday clock while the more excitable Nasdaq 100 was a mere -0.1 percent lower. Given their proximity to record highs and the engrained expectations through momentum associated to seasonality, it is remarkable that the ‘buy the dip’ call hasn’t been met with greater enthusiasm. Where the restraint is even more impressive in statistical terms was the Dow’s measure of realized volatility. In the past 20 trading days – equivalent to one month – the blue chip’s ATR (average true range) dropped to its lowest level since December 2nd, 2019. The end of year holidays are approaching, but we aren’t there just yet…
| Change in | Longs | Shorts | OI |
| Daily | -18% | 18% | 7% |
| Weekly | -19% | 14% | 4% |
Chart of Dow Jones Industrial Average with 50-Day SMA and 20-Day ATR (Daily)
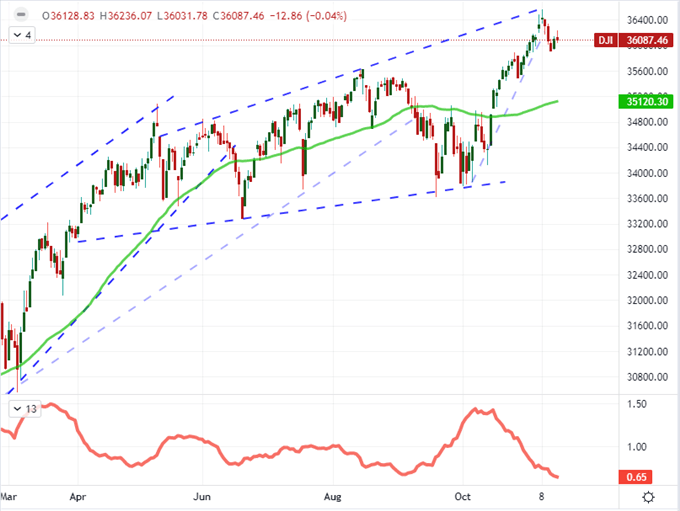
Chart Created on Tradingview Platform
Looking to single name tickers at the kick off of the trading week, Tesla (TSLA) seemed to lose some its luster among both bears and bulls. Though the EV maker closed at a three-week low while extending its reversal, the -1.9 percent slip was a significant moderation of bearish pressure. A more newsworthy name Monday was Dow-component Boeing which rallied 5.5 percent on the heaviest volume in four months. The airplane manufacturer benefit from various reports suggesting China will soon clear the company’s 737 to fly again, that the 787 Dreamliner deliveries will soon resume and indications that air freighter traffic is exceptionally strong. I have made a point of monitoring the ratio of the Nasdaq 100 to the Dow Jones Industrial Average. The Tesla-Boeing comparison may offer a more sensitive measure – though there is no guarantee that its influence will spread.
Chart of Tesla with Volume and 100-Day SMA (Daily)
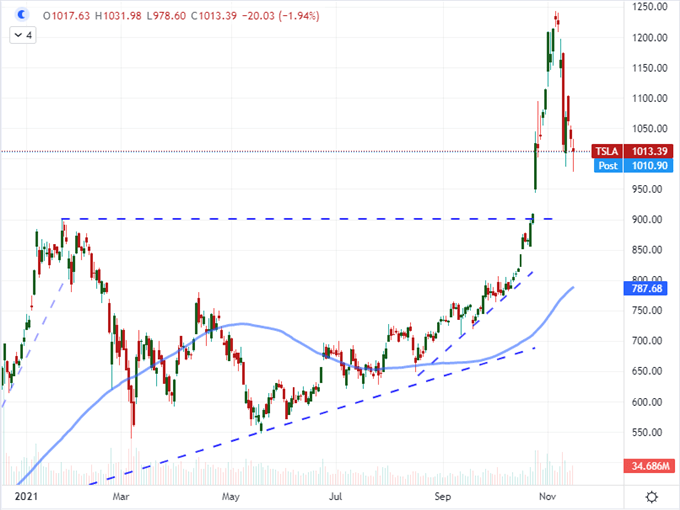
Chart Created on Tradingview Platform
The Biggest Mover of the Day: EURUSD
For those keeping tabs on the macro themes, it was difficult to miss the extended slide from the world’s most liquid currency pair. EURUSD dropped -0.7 percent, or 76 pips to close below 1.1400 for the first time since July 2020. This would seem clear recognition of the technical importance of last week’s 1.1500 break which was the midpoint of the March 2020 to January 2021 bull wave followed by the 1.1450 figure which was the center of the January 2017 to February 2018 surge. On the fundamental side, a weak argument can be made for the relative perspective of growth potential on the United States’ infrastructure bill passing into law, but we had plenty of forewarning for that outcome. I think the monetary policy backdrop riding the inflation wave was the principal motivation for this cross.
Chart of EURUSD with 100-Day SMA (Daily)
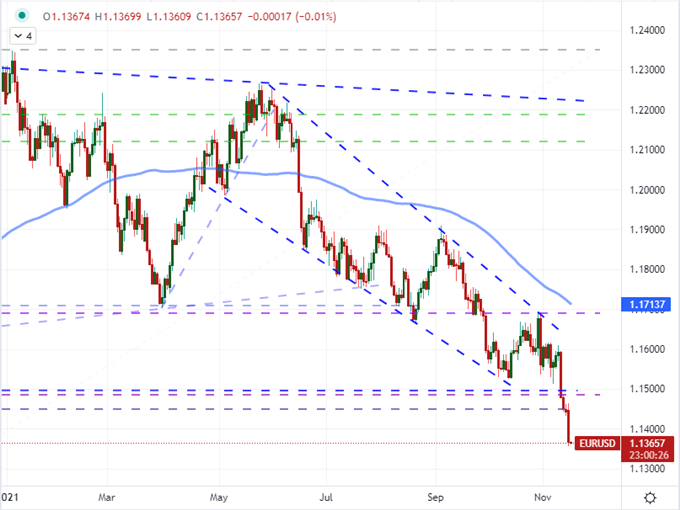
Chart Created on Tradingview Platform
Last week, the core drive was the US Dollar’s strength, fostered by the fresh 30-year high from the US consumer inflation update. It would seem that we are simply carrying over that trend to this new trading week, but a quick look to other USD-based crosses would quickly dispel that notion. GBPUSD, USDCAD, AUDUSD and NZDUSD actually registered losses for the top currency. Not a major retreat for the Greenback, but certainly not the rally suggested by the benchmark cross. That would put the onus of performance to a slide from the Euro. That lines up with a retreat from EURGBP, EURJPY and EURAUD. What was pushing the world’s second most liquid currency to retreat? ECB President Christine Lagarde, in her testimony to the EU’s Parliament, suggested that the policy group expected consumer inflation to run hotter than was previously expected over the coming year but that they will bear the pressure without adjusting the benchmark rate.
Chart of Perception of Relative Monetary Policy
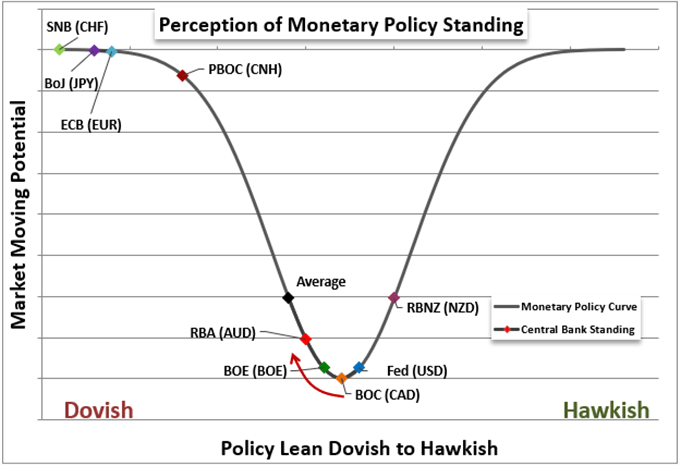
Chart Created by John Kicklighter
Top Event Risk For Tuesday: US Earnings and US Retail Sales
Looking out over the next 24 hours of trade, there are a few fundamental listings that are worthy of attention. The UK employment data for October and Eurozone 3Q employment change offer an important labor market update for the European continent, but that isn’t where the market has spun up much of a volatility response. Later in the day, the US retail sales report for October carries significantly greater weight. Last week’s University of Michigan consumer sentiment survey focused concern on Americans’ ability and appetite to spend between the competitive market for jobseekers and the pressure of higher inflation. For a more comprehensive economic read, the industrial production figure for October and November NAHB housing market index will give a broader overview of economic health. To hit upon a much more productive market theme, the October import and export inflation numbers can extend the pressure exerted by last week’s data. If the Dollar can take up the reigns for EURUSD momentum, it will register as a more lasting drive fundamentally.
Calendar of Major Macro Event Risk for the Week
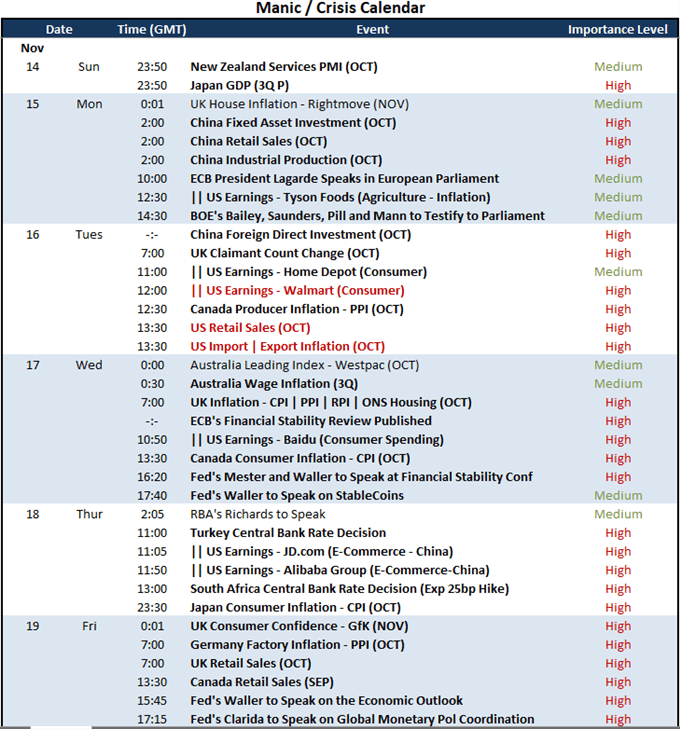
Calendar Created by John Kicklighter
Speaking of inflation, we will draw a different perspective on this same matter Tuesday before the US open via the earnings calendar. Though we are in the tail end of third quarter corporate reporting, this week’s theme is retail giants. Tuesday’s top listings are Home Depot (expected 11:00 GMT) and Walmart (12:00 GMT). The former was a pandemic darling as people spent the time at home fixing up their homes. WMT, on the other hand, was a consumer powerhouse that has attempted to shift from brick-and-mortar to online sales with uneven success. More important for this key player is its more thorough means of evaluating the appetites of the American consumer and its exposure to supply chain constraints burdening global trade.
Chart of Walmart with Volume Overlaid with Home Depot (Daily)

Chart Created on Tradingview Platform


