


S&P 500, Nasdaq, Dollar, Gold, EURUSD and GBPUSD Talking Points
- The DXY Dollar Index surged above 94.50 for the first time since July 2020, while EURUSD finally broke below 1.1500
- Headline and core US inflation readings hit levels not seen in three decades Wednesday, a charge to Fed rate forecasts and added weight on struggling ‘risk’ assets
- Tesla’s struggle is a lingering threat of speculative avalanche, China is hardly containing Evergrande and data threatens Pound and Mexican Peso volatility ahead

A Tentative S&P 500 Reversal and Dollar Breakout Registers as Risk Aversion
As I say perhaps too often: there are few stronger motivations for the global financial system than a fundamental shift in underlying system (also referred to as ‘risk appetite). Have we seen such a transition away from the complacent bullish bid championed by the ‘diamond hand’ and ‘buy the dip’ crowds since the recovery from the pandemic began? For those with a higher threshold of risk tolerance, the S&P 500’s first down day in 9 trading sessions – as seen on Tuesday – may be enough to found an assumption. On the other end of the spectrum, the conservative market participant can look for a broad risk aversion with meaningful technical progress through a variety of exposed assets. I fall somewhere in the middle. The S&P 500 has indeed led its US peers in its correction from record highs, but the depth of reversal has yet to register as a critical breakdown while other unrelated measures (eg global indices, emerging markets, carry) present none of the pressure and urgency. I’m ready for a cascade if one arises, but picking tops is a hazardous approach to markets.
| Change in | Longs | Shorts | OI |
| Daily | 1% | -1% | 0% |
| Weekly | 15% | -13% | -1% |
Chart of S&P 500 with 20, 50 and 200-Day SMAs, Consecutive Candles (Daily)
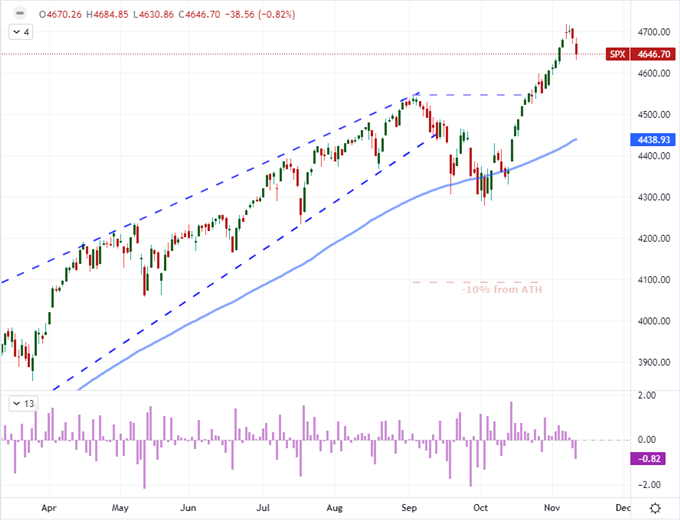
Chart Created on Tradingview Platform
While the market-at-large may not be ready to deleverage in mass, there are still a number of the speculative champions that have raised macro concerns – and have presented opportunities in their own right. While a broad erosion of all risk assets at the same time would be convenient, such collective unwind in the beginning of turns happens rarely. Alternatively, concerns that are borne out of troubles from leading market measures can trigger speculative avalanches. While there are few market cap leaders, I have been monitoring Tesla as a symbolic forerunner. Wednesday evening, CEO Elon Musk’s S-4 form showing his intention of a large shares sale suggests he was planning to liquidate part of his holdings to cover options positions, suggesting his scrutinized poll on Twitter was superfluous. TSLA’s open Thursday should be watched closely, as should the higher level of risk measure in the Nasdaq 100’s slide relative to the value-based Dow index. Between single tickers, the relative US tech sector performance and regional comparison of the S&P 500 to ‘rest of world’ stocks; I am more interested in NDX-DJI.
Chart of Nasdaq 100 to Dow Jones Industrial Average Ratio with 100, 200-Day SMAs (Daily)
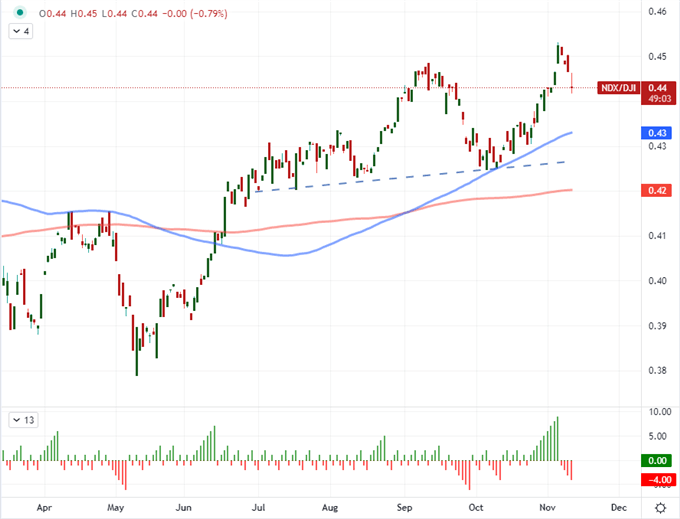
Chart Created on Tradingview Platform
Dollar Taking on a Safe Haven Role or Benefiting Inflation Data?
When ‘fear’ is running rampant through the financial system, safe havens like the US Dollar typically find a strong bid as capital seeks shelter. As a notable counterpoint to the S&P 500’s slide, the Greenback surged this past session. The trade-weighted DXY index posted its biggest single-day rally since mid-June and subsequently cleared 94.50 resistance that has capped its ambitions for 15 months. For EURUSD, the progress represents a break of a critical level in 1.1500. It is possible that risk aversion is adding some additional lift to the Dollar’s bid, but I believe the rally is principally a response to the charged implications for US rates following the update on consumer inflation for the past month.
Chart of DXY Dollar Index with 20 and 100-Day Moving Averages with 1-Day Rate of Change (Daily)
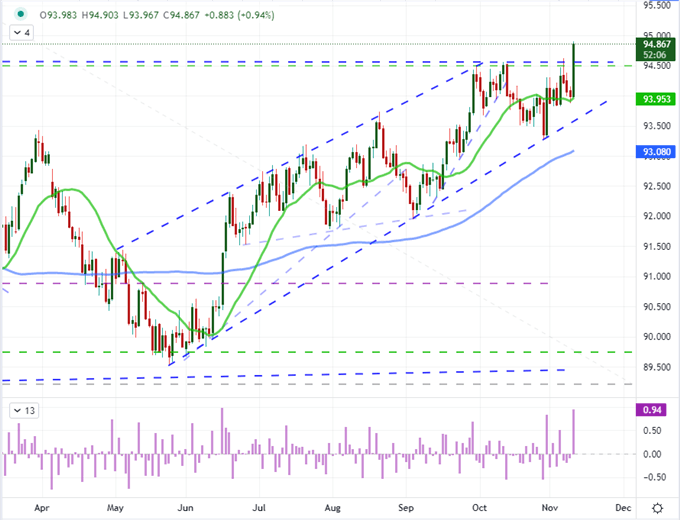
Chart Created on Tradingview Platform
The US CPI update was the headiest event risk on tap this past session – perhaps for the week – and it proved even more market-moving than I had expected. We have seen the market disregard the rise in interest expectations, the Fed’s taper announcement and various other warnings that a change is coming. Are the fundamental disparities to market prices finally drawing recognition from over-extended market participants? With headline inflation charged to 6.2 percent and core at 4.6 percent, the pressure on consumption power is the highest in three decades. In turn, US 2-year Treasury yields rallied and the implied rate forecast for 2022 from Fed Funds futures showed the market is once again fully pricing in two 25bp hikes next year. If recognition and acceptance of a higher rate environment in the foreseeable future gains traction, it could prove a deeper well for risk trends and exchange rates. However, the next critical milestones to offer insight into this theme is some way’s off, meaning it may just as easily fade to the backdrop allowing the BTD crowd or alternative fundamental matter wrest back control.
Chart of Headline and Core US Year-over-Year CPI (Monthly)
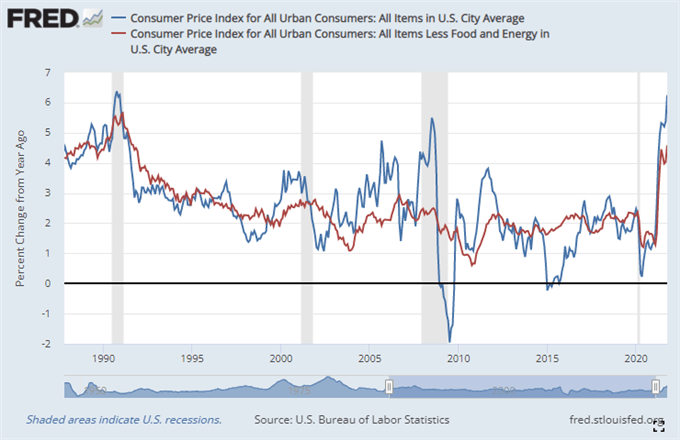
Chart Created on Federal Reserve Economic Database
Another impressive market performance that offers critical insight on the market’s currents as much as presents its own trade vehicle is gold. The precious metal rallied as the US indices slipped. That could be construed as a risk aversion signal, but it is also remarkable that the commodity charged higher at the same time as the Dollar. The USD is the primary pricing measure for gold, so it is unusual when they move in concert when fundamental themes are under power. That said, there could be an alternative matter in that higher inflation and a lagging response from global monetary policy is eroding the value of ‘fiat’ assets, which boosts the appeal of this infamous anti-currency.
Chart Gold with 200-Day Moving Average and Consecutive Candles (Daily)
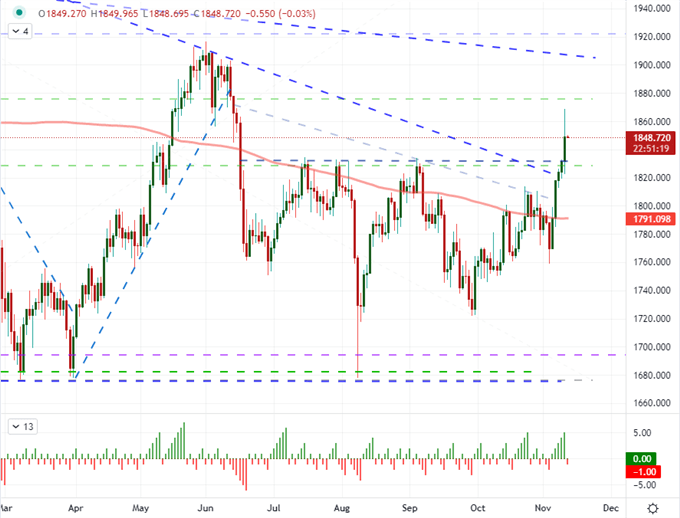
Chart Created on Tradingview Platform
Setting the Themes Aside, Top Event Risk for Thursday
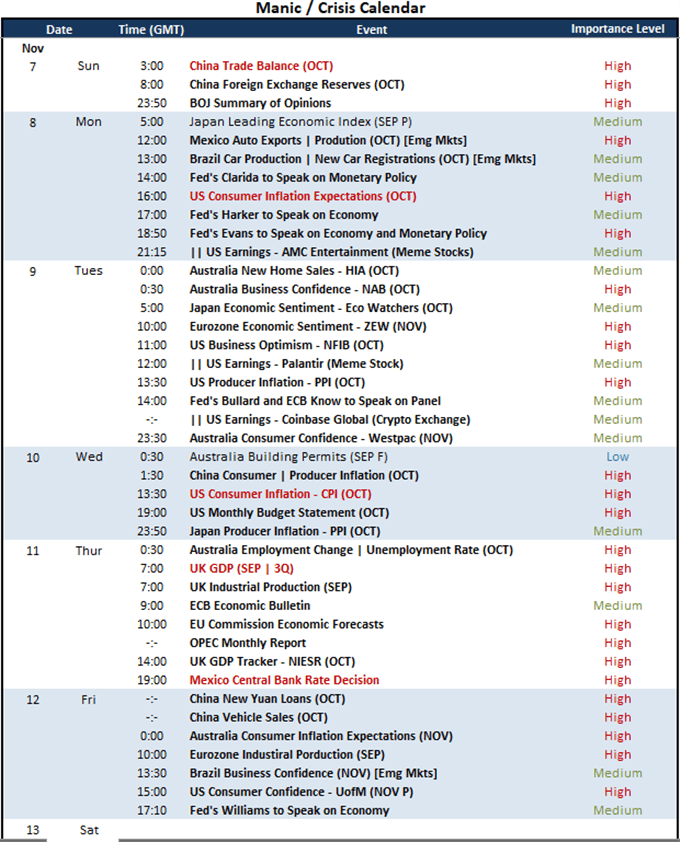
Ultimately, if a strong risk-based collapse builds traction and sheds the hopeful, I will prioritize my considerations for trade opportunities through that particular lens (ie “what trades best take advantage of true risk aversion). Yet, while waiting for a more definitive sign around faltering convictions, there is other event risk both on and off the calendar that can generate some localized volatility. China remains an ongoing but obfuscated threat to the global system. There were conflicting reports on whether Chinese real estate giant Evergrande paid three separate interest payments that had come to the end of their grace period. I don’t expect the Shanghai Composite or Chinese Yuan will be the best confirmation of this or future localized risks. More routine a fundamental update, Thursday will also bring Eurozone economic growth forecasts from the ECB and European Commission. If the outlook fades, it could amplify the Dollar’s technical break with EURUSD follow through.
Calendar of Major Macro Event Risk for the Week
Calendar Created by John Kicklighter
Speaking of disparities in different outcomes for key events, I believe GBPUSD is well positioned should its September (and third quarter) data disappoint. Cable dropped below 1.3425 this past session largely due to the Dollar’s charge, but follow through likely requires the Sterling’s sign off. With UK GDP, industrial production, construction activity and trade data all due Thursday morning London session, there is enough gun powder to add momentum to the exchange rate. That said, if the data generates some optimism for the Pound, it will only work to confuse the major cross. For a bullish response, it would be better to scope out alternative crosses that aren’t as fundamentally messy – like EURGBP, GBPCAD or GBPAUD.
| Change in | Longs | Shorts | OI |
| Daily | 3% | -7% | -3% |
| Weekly | 4% | -10% | -5% |
Chart of GBPUSD with 100-Day SMA and 1-Day Rate of Change (Daily)
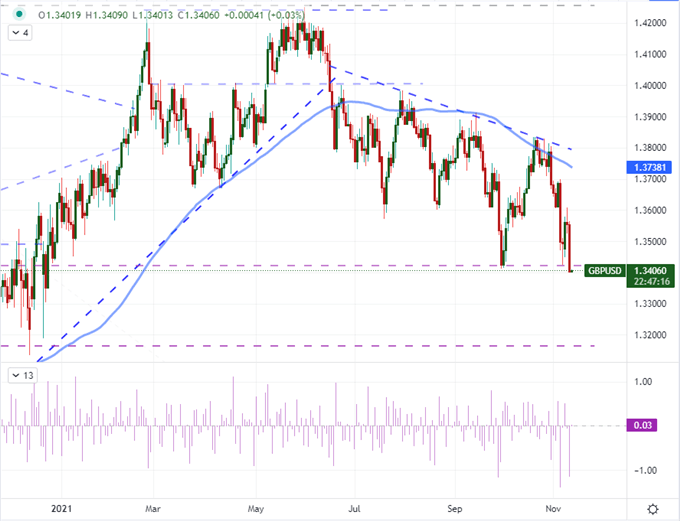
Chart Created on Tradingview Platform


