


Nasdaq 100, USDJPY, GBPUSD, NFPs and USDCAD Talking Points
- The Nasdaq 100 continues its charge with a 9th consecutive day’s advance – while the Dow and Russell 2000 slip and other ‘risk’ assets carve varying tracks
- Where the market discounted the Fed’s taper announcement Wednesday, the BOE’s hold against expectations of a hike sent the Sterling tumbling
- Monetary policy remains an onerous theme but scheduled event risk makes concentrates on USDCAD between US and Canadian employment reports

The Nasdaq 100 and S&P 500 Pull Away from More Reserved Risk Trends
Risk appetite is soaring…depending on what benchmark you prefer. If your baseline is global equity indices, emerging market capital assets or carry trade; the backdrop is generously described as ‘mixed’. However, from the pace-setting Nasdaq 100 and S&P 500, there is an unrelenting climb to fresh record highs on a daily basis. While may first look is always to the SPX given the heavy derivative exposure in portfolios channeled through the index, it is the tech-heavy index’s nine-consecutive day stampede that truly stands out. Not only was 1.3 percent rally this past session above 16,300 a milestone, but this string of gains is the longest in 11 months and in genuinely rarified territory historically. The statistical anomaly paired with the inconsistency to fellow risk measures suggests that this is a tactical effort rather than a community bid in ‘risk trends’. Nevertheless, the bull trend is hard to miss; though with NFPs on tap for Friday, it can represent as much a risk as an opportunity.
Chart of Nasdaq 100 with 20 and 200--Day SMAs, Consecutive Candles (Daily)
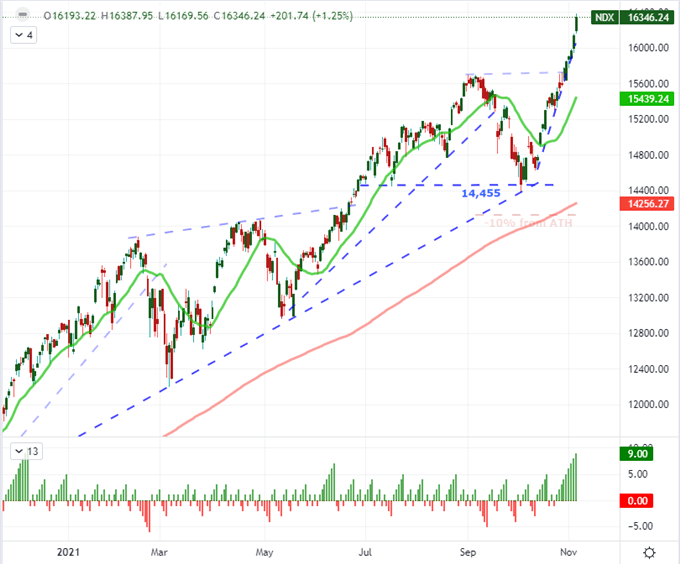
Chart Created on Tradingview Platform
Speaking of speculative appetite, I think it is important to highlight the concentration of sentiment. A swell in ‘risk trends’ is a deep well that can maintain a bullish trend for far longer than more prosaic fundamental developments. However, pure sentiment tends to show a uniform bid for anything that has even a mild ‘speculative’ appeal; and that is not what we are seeing at the moment. There is a concentration of speculative priority over the past 48 hours that can be shown in a number of areas – like US indices versus their counterparts. That said, it is the Nasdaq 100’s standing relative to the growth-oriented Dow Jones Industrial Average that stands out to me. Pushing a record high, we are closing in on the record high relation set during the absolute peak of the Dot-Com peak back in March 2000. Market’s can shift systemically, but this doesn’t seem a ‘healthy’ development everything considered.
Chart of Nasdaq 100 to Dow Ratio with 100-Day SMA (Daily)
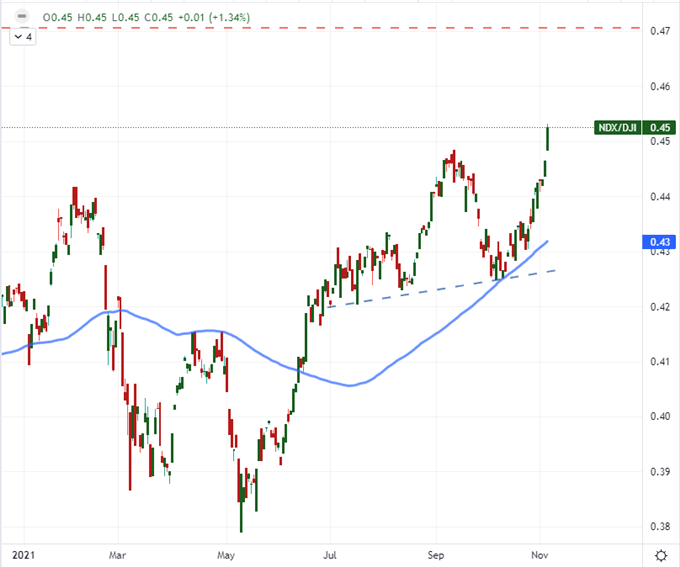
Chart Created on Tradingview Platform
Looking to less bombastic measures of speculative performance, the USDJPY as a potent carry trade forecast presents serious contrast to US indices by extending a deep carveout in congestion. The consolidation for the last 15/16 trading days is incredibly tight relative to the broader activity in the financial system. The exchange rate is working itself in a wedge with break points of 114.50 (upside) and 113.00 (downside) and historical precedence to suggest we are already moving into seriously unusual territory. This is an interesting pair to consider as a resilient ‘risk on’ view can help charge bulls to continue the advance given the Fed’s feeding rate forecasts while a swoon could call into question the build up of an asset that has seriously little carry to provide interest income.
Chart of USDJPY with 200-Day SMA, 15-Day Range and 15-Day ATR (Daily)
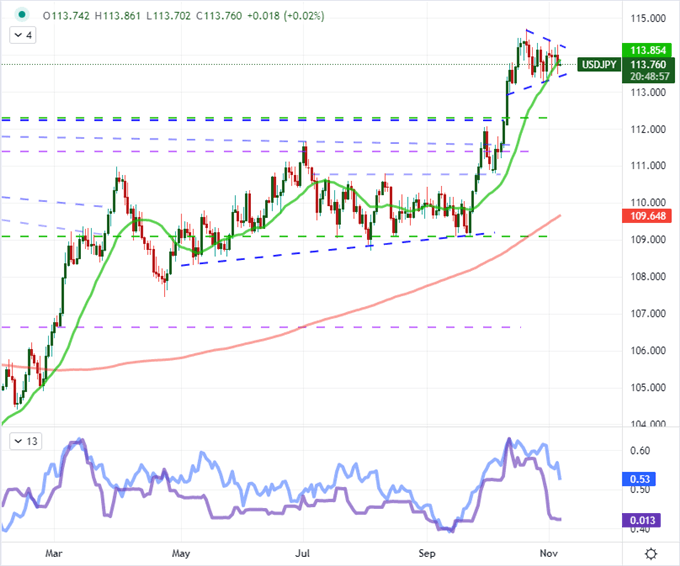
Chart Created on Tradingview Platform
A More Significant BOE Surprise Relative to the Fed’s Taper
On the more tangible fundamental side, this past session delivered a serious surprise. The Federal Reserve announced a taper – a significant monetary policy move – but that was an outcome deeply discounted by the market. From the Bank of England (BOE) this past session, a hold on its benchmark rate caught the market off guard. Though the Sterling didn’t seem to build up a significant premium in the lead up to the event, the anticipatory appetite seemed to be in the market. When the group announced that it was holding its benchmark at record lows along with its 1.22 billion pound QE program, the Sterling tumbled. The drop for the Pound was the biggest in a year-and-a-half while UK yields were overall crushed. It remains to be seen whether this has potential for trend, but it certainly triggered volatility.
Chart of GBPUSD Overlaid with UK-US 2-Year Yield Differential, 1-Day Rate of Change (Daily)
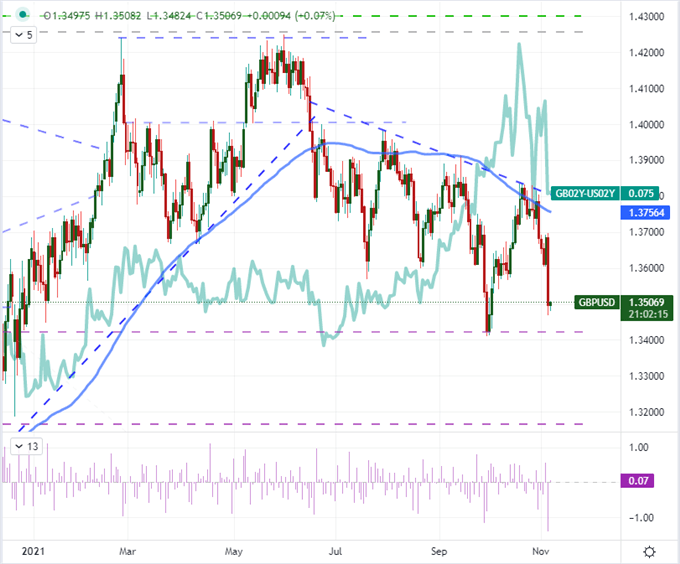
Chart Created on Tradingview Platform
Top Event Risk for Friday: US and Canadian Jobs Data
Moving from BOE rate decision into Friday event risk, there is a smattering of data that can generated some isolated volatility – and then, there are a few listings that could possibly stir systemic movements. From the mere isolated volatility view, the RBA policy statement, EU-UK Brexit ministers meeting, Coinbase earnings and US consumer credit data are all meaningful. But a significant escalation in potential is centered on the jobs data that is due through the North American session. Given the moderation in interest rate expectations in just the past 48 hours, this data will see its value seriously amplified.
Calendar of Major Macro Event Risk for the Week
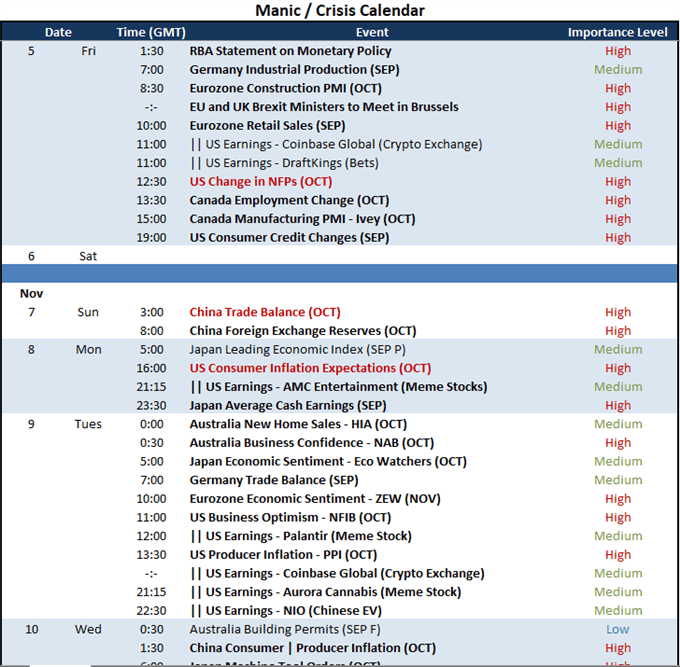
Calendar Created by John Kicklighter
Top listing is no doubt the US nonfarm payrolls (NFPs). We watch this net figure with all its statistical issues – it is an exaggerated number from a slim sample size – because it is easy to read. Ultimately, the employment health in the United States matters as it is an indication of the economy’s health, not to mention a bearing for monetary policy intent. The consensus forecast heading into the data release is for a net 450,000 addition in the job count in October, but there have been two, large shortfalls relative to the expected figure recently. How would a disappointment be registered? Would a weaker employment figure add to hopes that the first hike would be delayed or would it undermine the rudimentary view of economic potential for the Nasdaq 100?
Chart of US NFPs and the ‘Surprise’ Quotient Relative to Forecasts (Monthly)
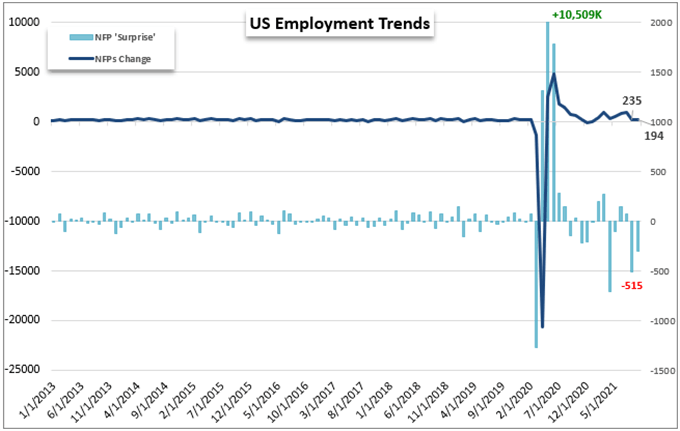
Chart Created by John Kicklighter with Data from BLS
If you want to simply prioritize volatility, there is an overlapping anticipation of event-driven charge through the final session of this week in USDCAD. Not only are we anticipating the US NFPs but Canada will also offer up its employment data for the same month and at the same time. It is rare when two, high-profile releases like these align (one bullish and one bearish) for a significant market movement. Instead, volatility is more likely errant and frustrating for those that were seeking out a clear trend. This pair looks overdue for a break from range, but this is not an event to precede with any conviction.
Chart of USDCAD with 100 and 200-Day SMAs and 20-Day Historical Range (Daily)
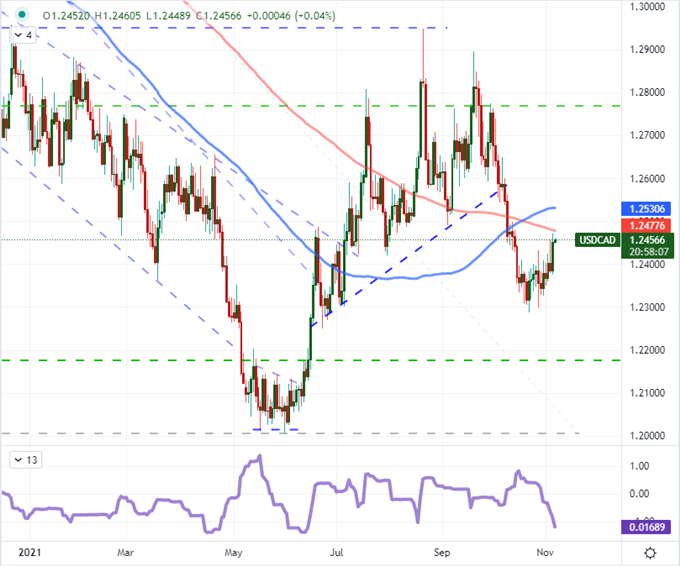
Chart Created on Tradingview Platform


