


Nasdaq 100, Facebook, Google, Earnings and USDCAD Talking Points
- The S&P 500 and Dow edged to a record high this past session, but the Nasdaq 100’s heftier gain looked more like a technical setback
- Earnings was an unquestioned support last week, but the response to Facebook’s miss – and more importantly Google’s and Microsoft’s beats – suggests the wave is flag
- Corporate financials will remain a key fundamental charge but the start of central bank decisions and charge to GDP statistics ahead will complicate any complacent bids

Risk Appetite Continues at an Uneven Pace – But Troubled Enough to Stall?
In the most technical of terms, the US equity indices posted record highs through the close of this past session with some headlines support from earnings and the Conference Board’s consumer confidence survey. However, the measure of progress does little to ensure that we will keep the winds to bulls’ sails. The Dow Jones Industrial Average notched a scant 0.04 percent gain, the S&P 500 ‘outperformed’ with a 0.18 percent advance and the Nasdaq 100 topped the charts with an outright tepid 0.29 percent gain. And yet, a glance at the NDX chart readily shows the mixed sentiment that we should draw from intent. While a day-over-day gain, an intraday rally attempt collapsed failing to overtake the early September high and leaving a large ‘upper wick’ in the process. With the fundamental outlook growing more complex, a passive market development – bullish or bearish – seems improbable. Either we will find strong motivation to rally, collapse or an anxiety-ridden anchoring.
Chart of Nasdaq 100 with 50-Day SMA (Daily)
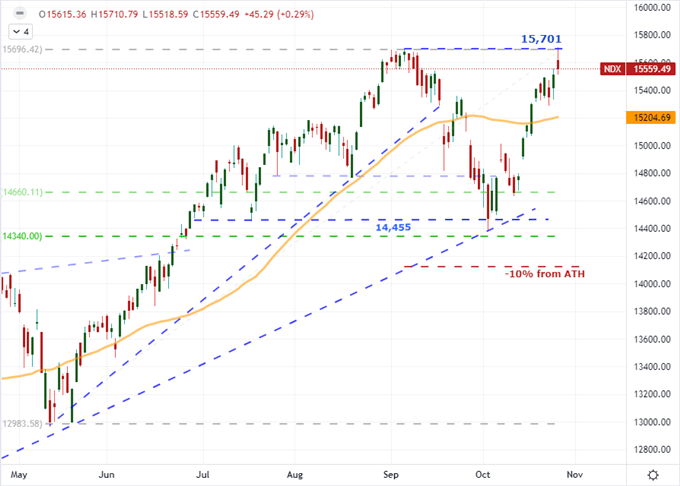
Chart Created on Tradingview Platform
The Generous Earnings Interpretation Starts to Fade
Over the past week, there have been some questionable interpretations of earnings that have been spun into a general bullish market performance for ticker and index. The confidence seems less connected to an actual enthusiasm around the data with its forecasts and more an overriding speculative appetite willing to overlook the shortcomings in the accounting. However, that beneficence seems to have reached some near term limits this past session. Facebook which reported earnings afterhours Monday with a revenue miss and $50 billion share buyback scheme to compensate traded higher in thinned afterhours markets but took a notable hit in active Tuesday trade with a slide beneath the midpoint of its past 7 month range and 200-day moving average. This has been a particularly troubled company of late, but it is still a FAANG member and thereby holds greater systemic weight.
Chart of Facebook with 50 and 200-Day SMAs and Volume (Daily)
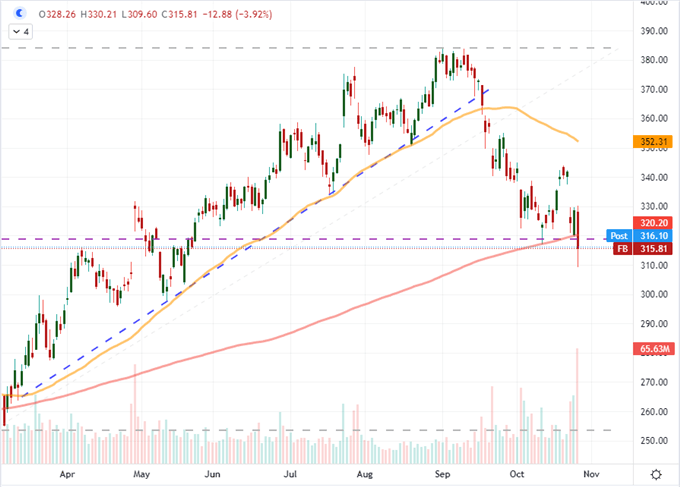
Chart Created on Tradingview Platform
The real concern comes in the afterhours trade on Tuesday. Among a large run of reporting companies, there were some higher profile updates after the close. I was particularly interested in Google, Microsoft and Twitter. The social media platform was the smallest in market cap and revenue, but it suffered a notable shortfall on EPS – though its revenues were inline to perhaps shake off some of the bad SNAP sentiment. MSFT managed to beat on both the top and bottom line with the $45.3 billion in revenue (against $43.94 billion expected) in particular standing out. Despite the implications, the stock gained rather little to extend its record high. Google, meanwhile, as a FAANG member beat against its own forecasts ($65.13 billion versus $63.39 billion) actually lost ground. There are details here for sure, but it is more remarkable to me how the markets are willing to discount the data. I will be looking to see how these tickers trade through active NYSE Wednesday trade and look out to Thursday’s Apple and Amazon earnings.
Chart of Google with 50 and 100-Day SMAs and Volume (Daily)
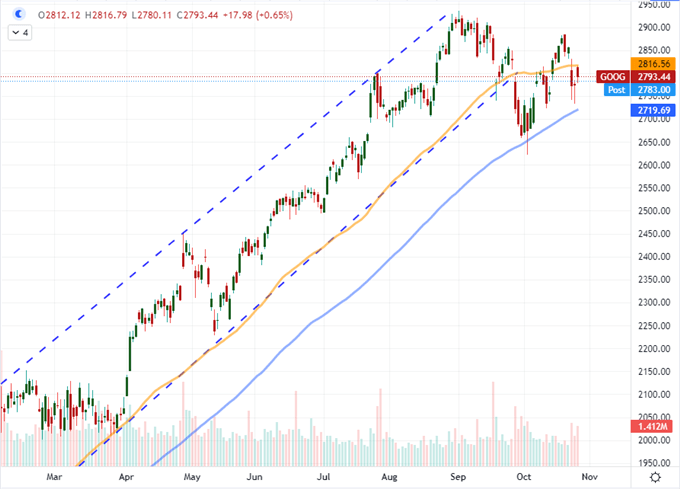
Chart Created on Tradingview Platform
The Fundamental Current Grows More Tumultuous
While earnings will remain a high profile speculative charge, there are other fundamental matters that will increasingly compete for the global macro perspective through the rest of this week and well into the week ahead – don’t forget that the Fed is due to decide on whether it is ready to taper next Wednesday. From Wednesday on, there are two other systemically capable themes that we will find the speculative masses drawing greater interest: economic growth measures and monetary policy.
Calendar of Major Macro Event Risk for the Week
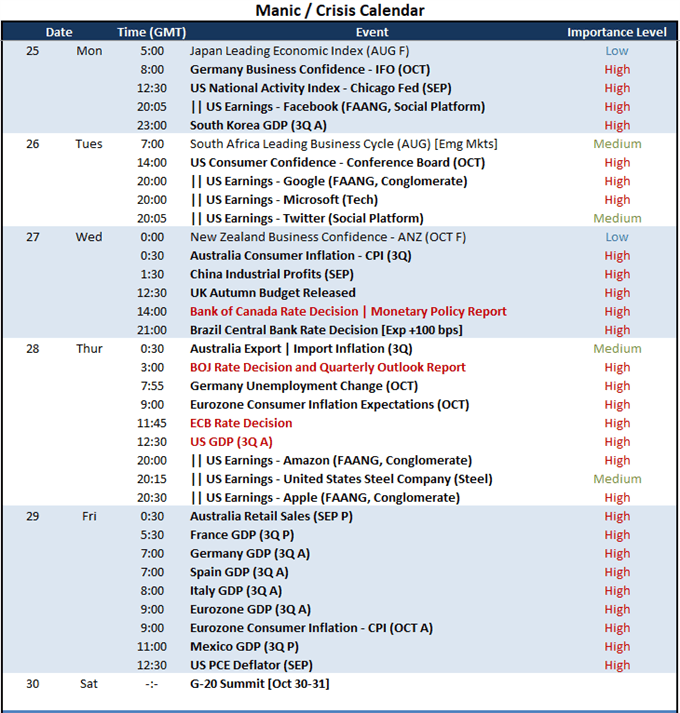
Chart Created by John Kicklighter
More explicitly, the collective monetary policy outlook can slowly alter the depth gauge on whether the transition from indefinite accommodation to a slow normalizing can seriously alter the natural inclination of the capital markets from default bullish to bearish. It is the Fed and European Central Bank (ECB) that really represent the most systemically-important groups with their singular decisions altering the perspective of the entire scale. Nonetheless, there are important groups perceived as being particularly hawkish on tap for the next 24 hours. Most notable is the Bank of Canada (BOC) which is not expected to significantly alter its policy mix, but nonetheless is expected to hike rates 100 basis points over the coming 12 months. That is aggressive. With USDCAD seeing its lowest realized volatility (ATR) over the past 10 days at the lows tested over the past 12 months and the relative 10-day to 30-day ATR at July 2020 lows, a break seems a high probability. More loaded is the anticipation for the Brazilian Central Bank which is actually expected to hike 100 basis points at this particular meeting. EM central banks are dealing with even more intense inflation issues and are typically more bold in their actions.
Chart of USDCAD with 50-Day SMA, 10-Day ATR and 10 to 30-Day ATR Ratio (Daily)
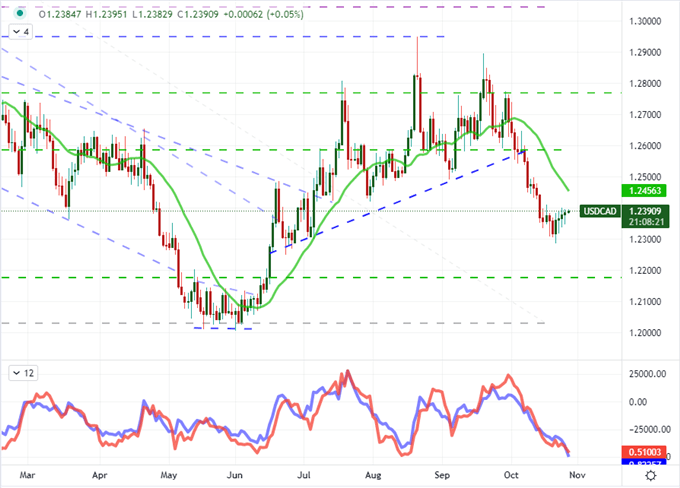
Chart Created on Tradingview Platform
While monetary policy may earn many of the headlines for the just the next 24 hours given the event risk on tap, another theme to keep firmly in mind as we look over the next 48 to 72 hours is GDP. We touched upon the theme this past session with data like the US consumer confidence survey which showed an unexpected improvement with intent from US consumers (the largest collective economic force in the world) to make large purchases. Similar data points from US durable goods orders to Chinese industrial profits to the UK’s Autumn budget also carry economic implications. Yet, the power of anticipation or Thursday’s US 3Q GDP release and Friday’s European run will likely build anxiety rather than allow a productive run on this dimension alone.
Chart of S&P 500 Overlaid with US Consumer Sentiment (Monthly)
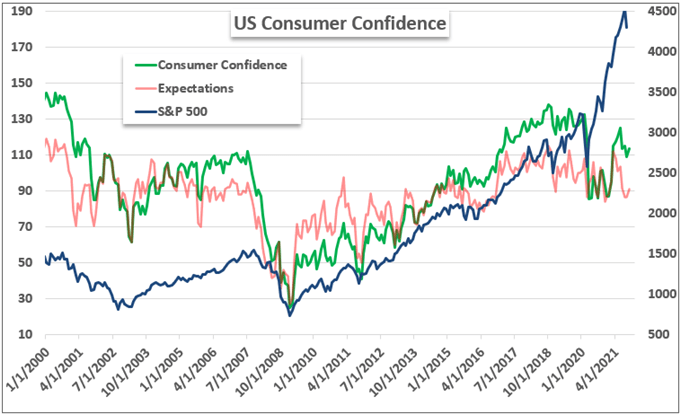
Chart Crated by John Kicklighter with Data from Conference Board


