


SPY S&P 500 ETF, Bitcoin, Dollar, EURJPY and USDCNH Talking Points
- The S&P 500 and Nasdaq 100 have both extended 5 consecutive day runs and are closing in on record highs – but altitude is likely to work against the trend
- Despite a divergence from Fed rate forecasts in the past weeks, the Dollar dove alongside the pullback in 2022 rate hike expectations this past session
- A similar disparity for other interest rate-sensitive markets could see pairs like EURJPY correct sharply, while GBP and CAD await inflation data and USDCNH recovers from a sharp tumble

The S&P 500 Has Advanced for 5 Straight Sessions and I doubt a Sixth
Risk appetite has been uneven this week, but that hasn’t kept the benchmark US indices from marching higher. The disparity in risk appetite across assets and regions may be as obvious as the lack of a strong fundamental motivation, but that hasn’t kept the SPY S&P 500 ETF from extending its recovery rally. I use that ‘recovery’ qualifier purposefully. A full-fledged bullish charge usually comes from a collective appetite or with a distinct fundamental drive. There is presently little from either column, which explains the isolated performance. For the SPY, Tuesday’s close notched a fifth consecutive advance with fading volume to match similar limited engagements over the past three months. It is possible that we push the counter up to a sixth straight session and edge closer to a record high. However, the higher the markets climb, the greater the weight will be to justify the record high costs. Earnings, cryptocurrency appetite, rate forecasts, growth projections and other leading themes are likely to offer little support to this lofty requirement.
Chart of SPY S&P 500 ETF with 20 and 50-Day SMAs, Volume and 2-Day ROC (Daily)
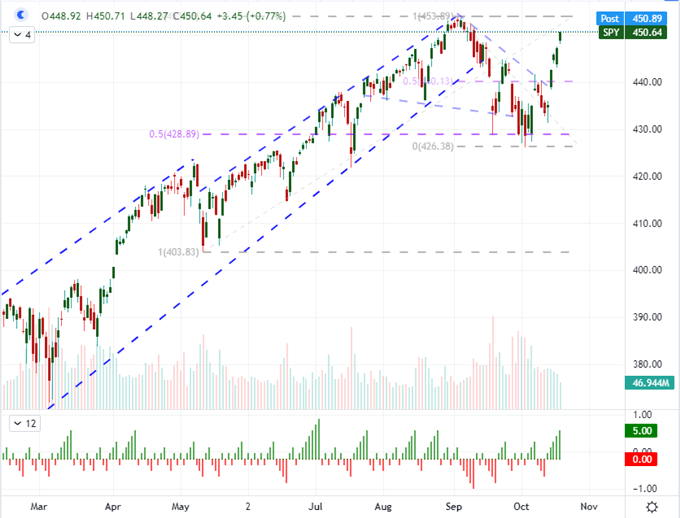
Chart Created on Tradingview Platform
On the general risk side, I note that heading into Wednesday trade, there was still a significant deviation in performance for other speculative assets. One very notable bed fellow in outright bullish interest though was Bitcoin. Not, the broader crypto market, as most coins established or emergent were treading water to some degree. It was BTCUSD that was truly earning its headlines moving to within inches of fresh intraday record highs right around the $65,000 mark. At the time of this analysis, we haven’t topped the symbolic peak, but the laser eyes crew is known to be relentless for reaching the milestones – though avoiding the call of profit taking is not truly worked out of the traders’ psyche. Clearly there was a distinct drive for this particular coin within this particular asset group: the first day of trade for the Proshares Bitcoin futures-based ETF, BITO. With a more than $1 billion volume debut (according to shares traded and closing price), this is one of the biggest ETF launches on record. If BITO draws in more capital Wednesday, it wouldn’t be difficult to translate the appetite into the coin it is meant to mirror.
Chart of Bitcoin (Daily)
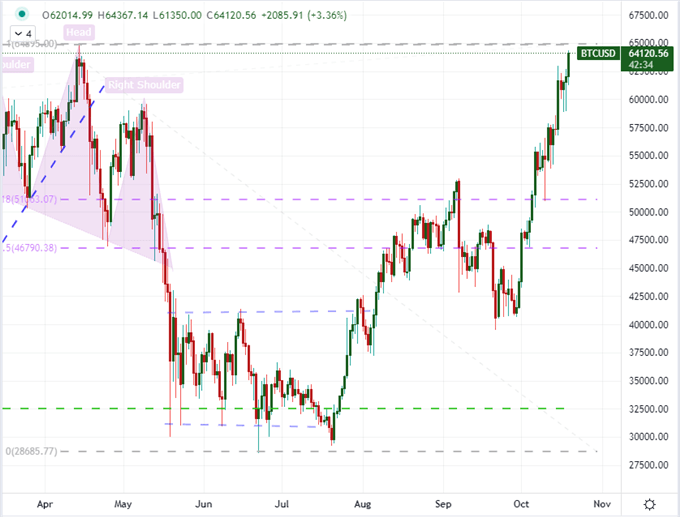
Chart Created on Tradingview Platform
A Distorted Interest Rate Relationship for the Dollar May Stage Yen Cross Volatility
I’ve been highlighting these past few weeks a distinct divergence in the relationship between Fed rate forecasts and the performance of the US Dollar. Despite the charge in the US central banks’ rate outlook – where the probability of two hikes reached 75 percent and swaps showed a 50/50 chance of a June hike – the Greenback refused to accept the support to extend a rally after a technical break. The technical correlations between the currency and forecasts tell the story well. On a 60-day (three-month) basis, the relationship was exceptionally strong and positive (+0.74). That said, in just the past 10 days (two-weeks), the correlation flipped to its strongest inverse reading in eight months. The rubber band snapped back, however, this past session when rate forecasts finally took a breather and the DXY finally dropped below its 20-day moving average for the first time in 24 trading days. Is this a full reversal back into a larger range? We will likely see the market determine its convictions in the next 48 hours.
Chart of DXY Dollar Index Overlaid with Fed Forecasts 2022 and Correlation 10, 60-Day (Daily)
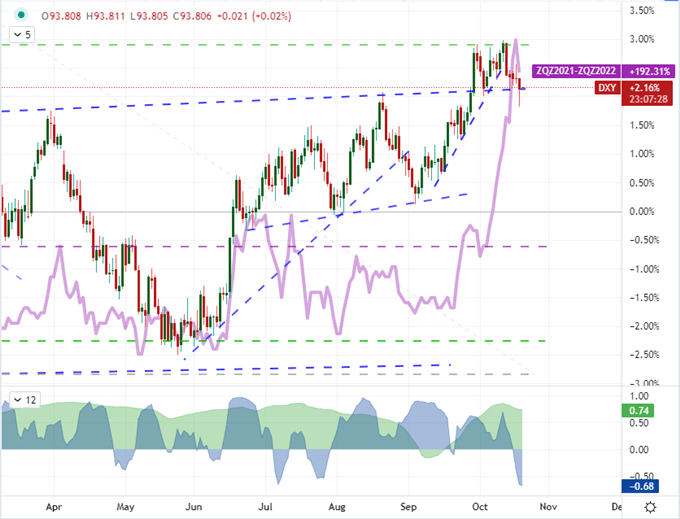
Chart Created on Tradingview Platform
While the Dollar’s medium-term deviation from rate forecasts is a prominent fundamental break, it isn’t exactly the prevailing relationship for the fundamental theme across the FX market. Swelling interesting rate forecasts for other major central banks like the RBNZ and BOC have contributed to measurable gains for their respective currencies in the past weeks. On a broader basis, the shift in the general monetary policy outlook continues to move towards normalization – outright hawkish is some ways away with a number of initial rate hikes that we need to secure. That said, the US rate forecasts certainly aren’t the only projections that have swelled in recent weeks. If we are due a broader cooling of hawkish enthusiasm in the near future, there are certainly lightning rods for carry appetite that stand out above the others. The Yen crosses are distinctly running hot, but the 9-day rally from EURJPY through Tuesday’s close is particularly remarkable to me. The ECB has attempted to quell creeping expectations of hikes in the foreseeable future, but investors haven’t gotten the message. A correction on this poor carry trade candidate would be among the best to leverage any turns.
Chart of EURJPY with 20 and 50-Day SMAs, Consecutive Candles (Daily)
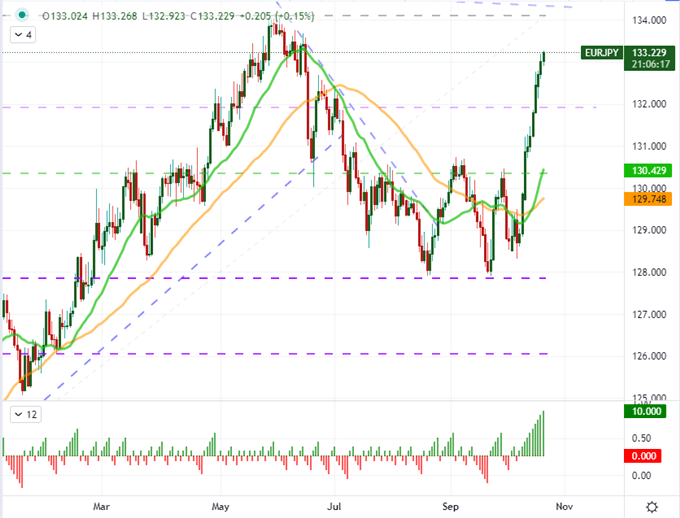
Chart Created on Tradingview Platform
Top Event Risk and Stand Out Moves to Monitor
For scheduled event risk, the docket remains lackluster as far as prominent indicators go. The earnings on tap offer up two very prominent macro reflections. The afterhours report from Tesla will interest the speculative investors that have treated the EV maker as a disruptive force all by itself. For a more traditional view, CSX’s reflection on the health of economic activity and supply chain constraints can make a serious statement. From the economic calendar, the UK and Canadian inflation data will be high-potential releases. For the former, the swaps market has shifted expectations for a first Bank of England rate hike to as early as December, which seems very aggressive. But that is perhaps not as aggressive as the Bank of Canada’s outlook which finds the markets pricing in up to four rate hikes over the next 12 months. GBPCAD is not a particularly ‘clean’ pair to gauge these competing event risks but it does look to absorb an inordinate level of volatility.
Chart of GBPCAD with 20-Day Moving Average
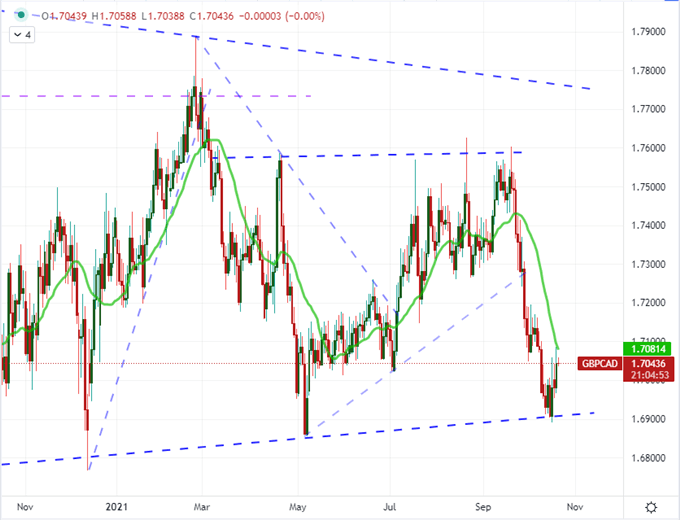
Chart Created on Tradingview Platform
As far as fundamentals go, there are a few data points due from the Chinese docket – housing inflation and loan rates – and they theoretically offer insight into the most prominent risk facing the economy at present. That said, I am not expecting a big revelation as expectations around the data are low while the ambiguity around the situation with Evergrande continues to draw as many questions as outright concern. This past session, Moody’s downgraded 7 major real estate firms in a single session, but the PBOC reaffirms the problem is under control. Meanwhile, USDCNH suffered one of its biggest single-day declines of the past year with news that China reduced its holdings of US Treasuries to its lowest levels since 2010 in August. I don’t think this data really had that impact nor that the Dollar’s own troubles inspired a move of this magnitude. There is still ‘manufactured’ influence possible here, but it seems unlikely that a break of the multi-year trendline support will be allowed to give way.
Chart of USDCNH with 1-Day Rate of Change (Daily)
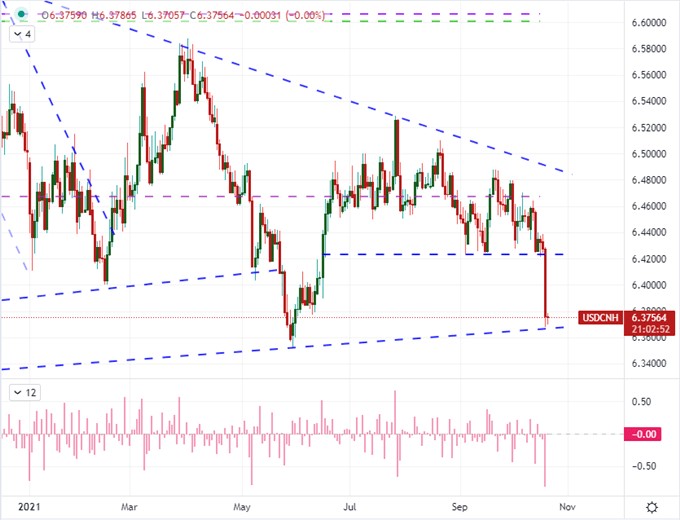
Chart Created on Tradingview Platform


