


S&P 500, Dollar, Treasury Yields, GBPUSD, USDTRY and Evergrande Talking Points
- Despite the Fed’s warnings that a taper was on the immediate horizon and other central banks were joining the slow firming of policy, the S&P 500 rallied this past session
- The Dollar seems to have failed in its breakout as the Fed’s peers keep pace with the US central bank this go around
- Event risk thins out through Friday – and into next week – which opens up the market to the influence of unscheduled event risk like Evergrande

The Post-FOMC Market Compass Setting
While the Federal Reserve’s policy views are officially behind us, we will feel the impact of the event for some time. Despite the warning from the world’s largest central bank that the taper is at hand – barring any serious problems – and the offer of a tangible timetable for the first rate hike, risk appetite managed to extend its recovery. We are heading into Friday trade with the S&P 500 back above the 50-day moving average following this past session’s 1.2 percent rally. This climb comes on three consecutive and large bullish opening gaps for the benchmark index that has offered quick balance to what was initially severe concern to open this trading week. Committing to a speculative breakdown is no small feat – even if panic is more weighty that greed in the sentiment category. In technical terms, the SPX is looking at a situation where former support is new resistance, but I would urge caution on the view for ‘risk trends’. While the US indices have found some balance, other measures in this same category are far less reassuring with their own charts. And, given the seasonal expectations with the structural issues – like Evergrande and slowing growth – on tap, there are serious holes through which confidence can fall.
Chart of SPY S&P 500 ETF with Volume, 50 and 100-Day SMAs and ‘Tails’ (Daily)
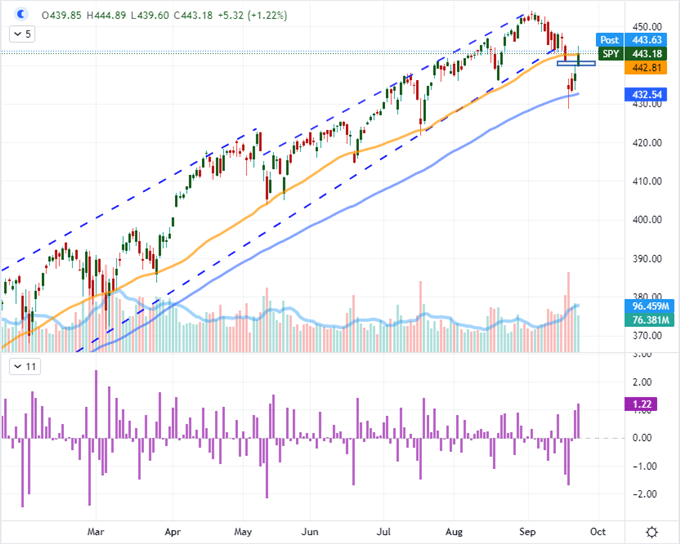
Chart Created on Tradingview Platform
With the FOMC rate decision, run of peer central bank rate decisions and the September preliminary PMIs behind us; we are looking at a fairly open economic docket. That can both represent a boon to speculative recovery but it can also lead the market to take a deeper introspective look at its own standings. There is little mistaking the general shift in monetary policy towards withdrawing its open-ended support as well as the moderation in economic expansion as the ‘recovery’ rally cools. Unless there is something else that fosters the drive for opportunism (known as ‘bid the dip’ mentality in other circles), it may prove difficult to extend this trend very far. As it stands, the S&P 500 is slightly higher on the week which breaks from the seasonal norms which suggests the benchmark registers a loss in the 38th week of the year (averaged out over the past 120 years). Breaking this norm doesn’t guaranteed an unchecked bull trend as surely as consistency doesn’t cue a full plunge. Nevertheless, it is a norm for which we should account.
S&P 500 Weekly Performance Averaged Over 120 Years
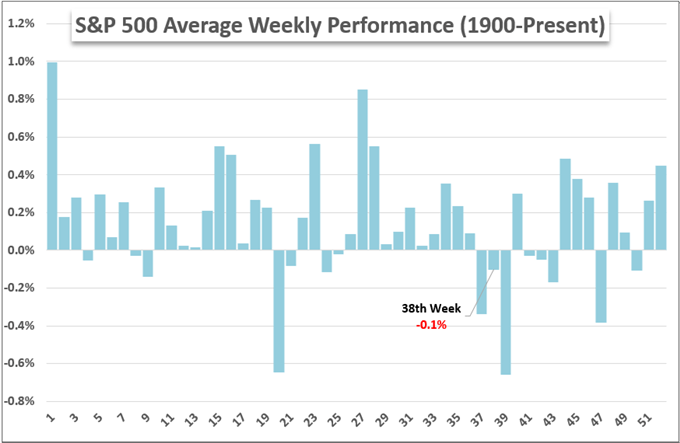
Chart Created by John Kicklighter with Data from Bloomberg
Post-FOMC, Yields Rise and Dollar Slides
In the aftermath of the Fed’s warning that a taper is likely on tap for the early November meeting, the taper is likely to end by mid-2022 and the first rate hike could come by end of next year; we have seen some interesting market reaction. Not only have risk trends bucked their typical correlation to the moral hazard-inducing stimulus drive, but we have also seen the US Dollar drop through this past session. That is certainly not a textbook response to the fundamental developments, but the general shift away from dovish policy settings across the board and the technical requirement of the next bullish break from the Greenback make for a dampers to loosely established drives. It could be argued that the market simply read the Fed’s remarks as dovish or that monetary policy is just broken from signal; but the charge in the 10-year Treasury yield – a 10 percent rally, the biggest single-day move in 7 months – indicates that is not the case.
Chart of DXY Dollar Index with 100 SMA and US 10-Year Treasury Yield (Daily)
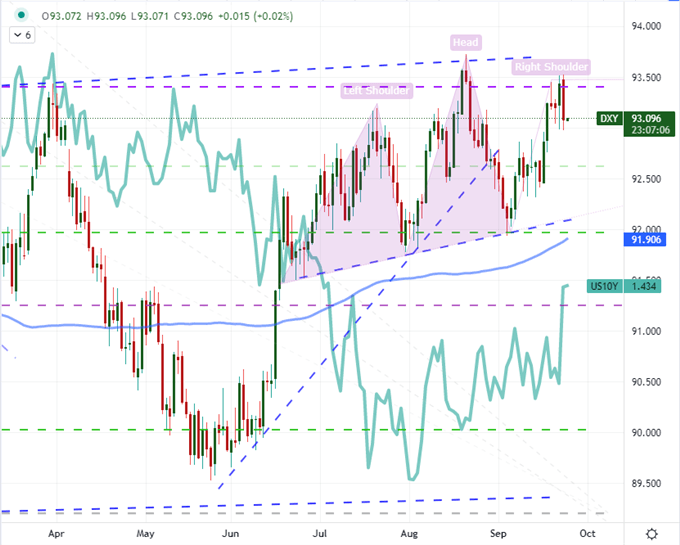
Chart Created on Tradingview Platform
Take a closer look at the bigger picture of monetary policy for which the Fed’s views fit, it is more tangible that the US central bank is not unique in its bearing – unlike the period back in in 2013-2015. From policy actions ove the past few months, we have seen withdrawal from dovish anchors from the likes of the Reserve Bank of New Zealand (warning of impending hikes), Bank of Canada (two tapers), Reserve Bank of Australia (tentative taper) and Bank of England (speculation of early 2022 rate hikes). That is diminishes the exceptional position of the Fed an the US Dollar. That said, the FOMC carries far greater weight in the grand scheme of things and the Dollar enjoys a unique safe haven status that can be further amplify its appeal given the proper circumstances.
FOMC Summary of Economic Projections Table
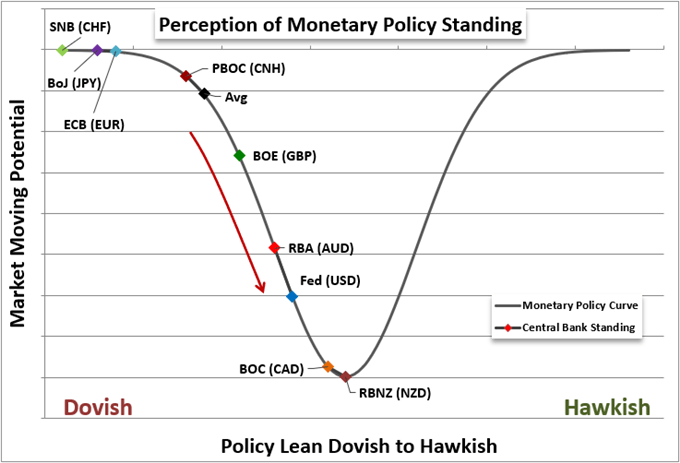
Chart from FOMC SEP for September 22, 2021
The Monetary Policy Plays
In the aftermath of the FOMC event whereby the central bank has cautiously signaled its intent to back out of an extremely dovish position, we have seen other groups attempt a similar normalization under the cover of the a more prominent counterpart. While the Dollar dropped across the board this past session, the slip was exacerbated through GBPUSD where the Sterling enjoyed a notable rally after the Bank of England held its own policy mix. On the one hand, the group softened its growth forecasts, but its inflation forecasts were also pushed to 4 percent through year-end. The market is pricing in a rate hike by as early as February next year which is well ahead of schedule relative to the Fed. Seeing a Cable rebound from 1.3600 resistance on that perspective is reasonable, but how far can this bullish run push? I believe it will cool quickly, but the break of the ‘neckline’ on the 8-month head-and-shoulders pattern will not be an easy hurdle.
Chart of GBPUSD with 100-Day SMA and UK-US 10-Year Yield Differential (Daily)
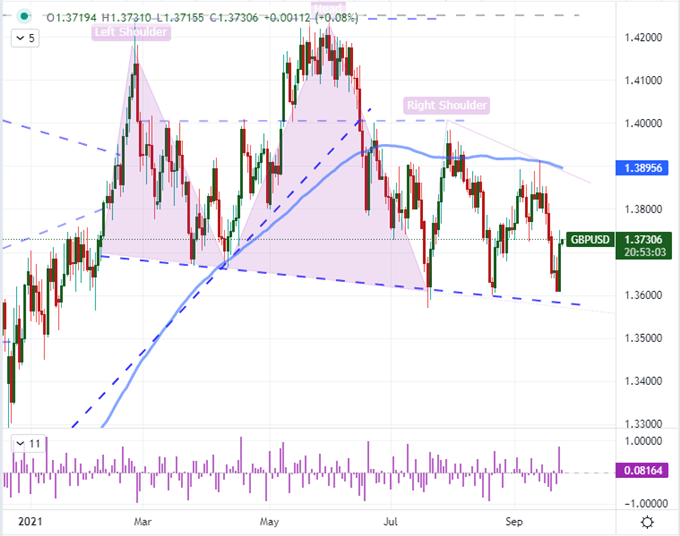
Chart Created on Tradingview Platform
BOE aside, there were a run of central banks decisions crossing the headlines this past session. The Swiss National Bank would not budget from its extremely dovish position of a -0.75 percent benchmark rate and the South African Reserve Bank held its 3.50 percent course as growth forecasts oscillated. The remarkable headline was from the Turkish Central Bank which was expected to hold steady but instead announced a 100 basis point cut, lowering the baseline from 19 to 18 percent. This move came despite the persistently high inflation in the country which the policy authority broke from Western economic norms as suggesting was actually a result of high interest rates. This move is not that surprising given the political pressure locally, but it will certainly undermine the central bank’s perceived effectiveness. I don’t believe USDTRY stalled at its record high as a clean double top with the June swing high, rather I believe it intervention. How effective is this cap? Time and pressure will tell.
Chart of USDTRY with 200-Day SMA(Daily)
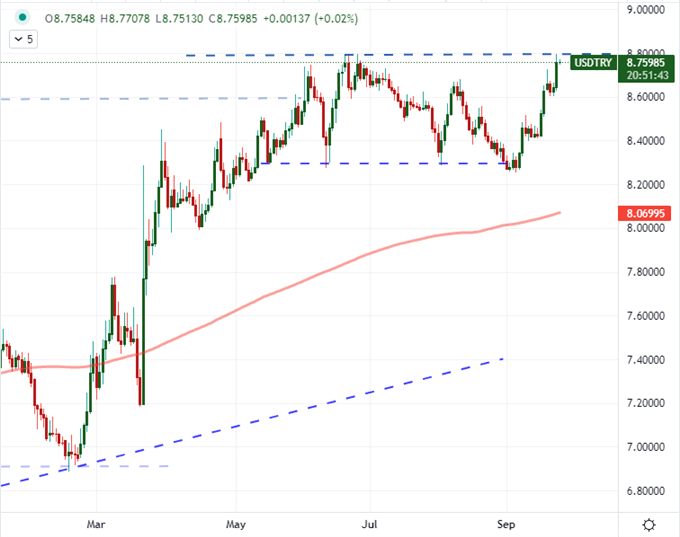
Chart Created on Tradingview Platform
Looking ahead to Friday trade – and beyond – there is not a lot of systemic event risk on tap. That is not to say there is no event risk. In fact, the listings we have are centered on sentiment data in both consumer and business veins, but the degrees of separation to more critical matters like interest rates and speculative fostering are a little further askew. In the absence of the bullying fundamentals, markets will resort to the unscheduled. In that vein we have matters like Evergrande’s spotty descent. China is likely to prevent the world’s most indebted property developer from turning contagion, but that doesn’t absolve its influence of spreading more generalized fear across the financial system.
Chart of Evergrande with 20 and 50-Day SMAs, 1-Day Rate of Change (Daily)
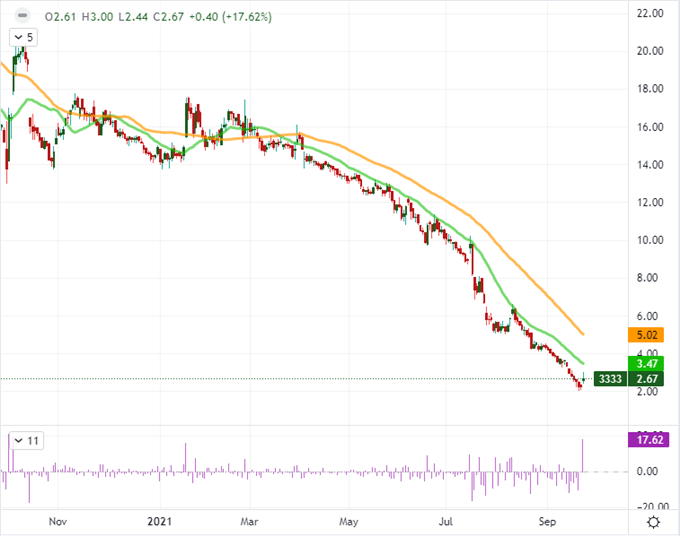
Chart Created on Tradingview Platform


