


S&P 500, Dow, VIX, Dollar, EURUSD and USDCAD Talking Points
- With the warning from the Fed Chairman that the taper is coming last week, the new week of trade opened to fresh S&P 500 and Nasdaq 100 record highs
- Appetite for ‘risk’ assets is far from even, a hallmark of speculative appetite without commitment, with the SPX to Dow ratio pushing two decade highs
- After a quiet start from the economic calendar, data is due to pick up later today with the US-based consumer sentiment survey a particular Dollar catalyst

A Further Concentration of Conviction to the Complacent and Voracious
Through the end of last week, the head of the US central bank made clear – or as clear as the trepidatious policy makers will allow – that a ‘taper’ in the massive stimulus program from the Fed was soon at hand. For those that are taking count of the exceptional support that this deep-pocketed buyer has offered over the past 13 years, that is a concern. Yet, complacency is a strong drug. So, the comfort of routine and the assumptions of seasonal constraints led the speculative rank to further build on their favorite trades. In particular, the S&P 500 and Nasdaq 100 would put in for fresh record highs through Monday’s close – a 0.4 percent advance to 4,529 and 1.1 percent drive to 15,605 respectively. These are familiar targets for the relentless optimists, but their performance is all the more remarkable for the divergence in course relative to other major benchmarks such as global indices, emerging market assets, carry trades and commodities favored by traders. While individual markets can run, correlation across such financial centers is my preferred gauge of conviction. How does this factor into practical investing decision making for me: I remain too skeptical to add to such a mature trend, especially while liquidity is thinned.
Chart of the S&P 500 with 50 and 100-Day SMAs and Consecutive Candles (Daily)
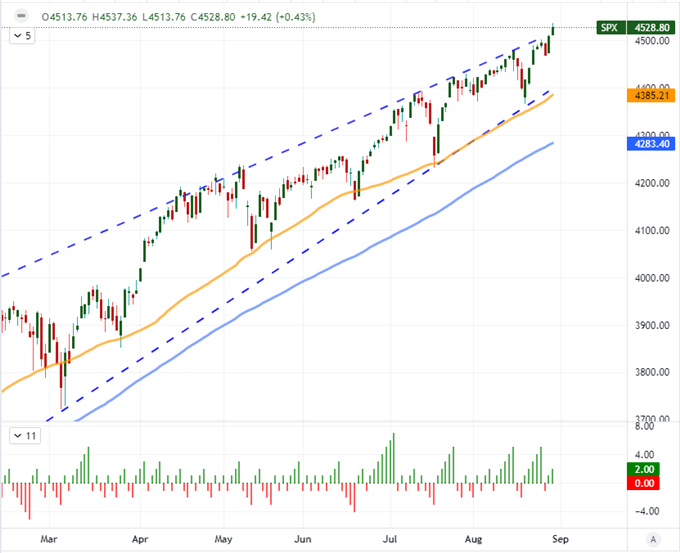
Chart Created on Tradingview Platform
When I compare different assets such as the equities to carry trade or US indices to European counterparts, there is a more substantial range of reasoning that can be pursued to explain the discrepancy. Perhaps it is a divergence in the pace of growth, regional credit risk or the outlook for returns. However, the breadth of motives narrows significantly when we see a drive arise from two very close peers. I am particularly fond of the ratio of the S&P 500 to Dow Jones Industrial Average ratio. Both are very popular US indices, but the former is far more popular for its trading appeal (via derivatives) and is considered the baseline for ‘the market’s’ performance while the latter is more a backdrop of ‘value’. When the ratio rises in favor of the SPX, I consider it a reflection of a market that prizes momentum over a more uniform valuation – in short a sign of speculative overindulgence. At present, the ratio is the highest since January 2001; and while I think it overdone, it doesn’t insinuate the a reversal is immediately at and. In a similar boat, the Nasdaq 100 to Dow ratio has pushed to a Dot-com era high of its own with about the same kind of acceleration.
Chart of S&P 500 to Dow Jones Industrial Average Ratio (Monthly)
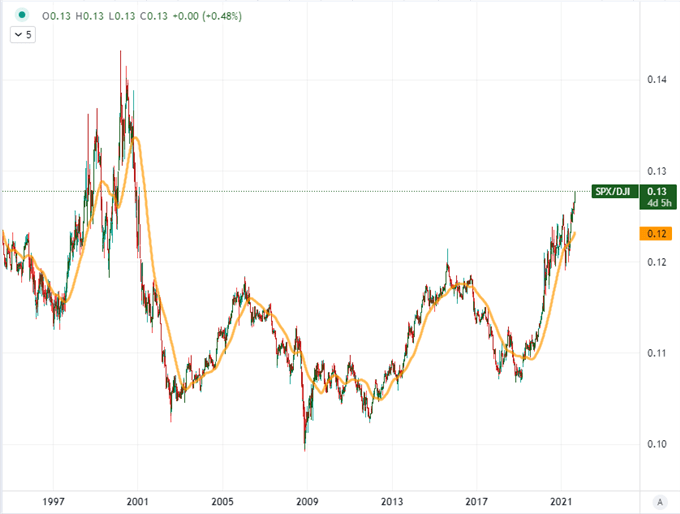
Chart Created on Tradingview Platform
Market Conditions Is Still My First and Most Important Filter
While frustrated traders are probably tired of hearing it, we are passing through the absolute doldrums of the Summer. That means that conviction in forging a lasting trend or charging a provocative reversal are impractical affairs for the time being – though not impossible. We are moving into the final trading day of August which is likely to see some measure of portfolio rollover into September, but this mid-week transition isn’t likely the light switch from quiet to active markets. If anything that comes around next week when we pass through the US Labor Day holiday weekend.
Chart of S&P 500’s Performance, Volume and Volatility via VIX Per Calendar Month
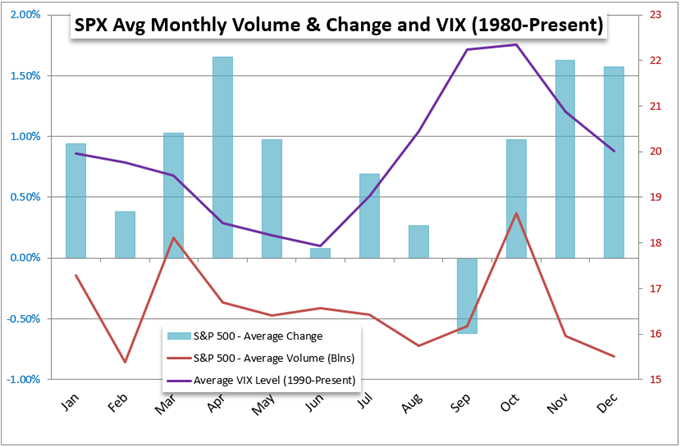
Chart Created by John Kicklighter with Data from Bloomberg
Yet, where the depth of market movement will be difficult to muster, brief intensity is still a very probable risk that we face. I like to use the comparison of volume or open interest for favorite risk benchmarks (like the S&P 500) and compare them to measures of implied volatility (or the VIX). As it happens, the performance of the same risk measure happens to hold an inverse correlation to volatility, which says something about the rate of turnover in bullish versus bearish markets. Since I’m looking for possible swells in short-term volatility and the VIX is a one-month outlook stalwart that is still more hedge than solo trading instrument, I like the VXX short-term volatility ETF for the purposes of spotting errant speculative activity for the current week.
Chart of S&P 500 Volume with 20-Day SMA Overlaid with VXX Short-Term Volatility ETF (Daily)
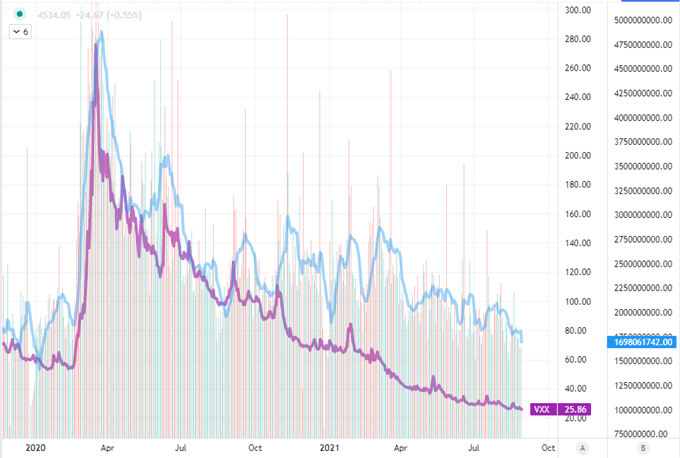
Chart Created on Tradingview Platform
What’s Ahead from Event Risk to Volatility Candidates
Looking ahead into Tuesday – and inevitably the days that follow – there are a few notable events that can urge some sharp activity from certain corners of the market. In Asia, the Chinese government PMIs for August are important economic updates. Yet, despite the country’s allowances for the record loss from its largest bad asset manager and the PBOC’s regular infusions of stimulus into the system, it is unlikely that this data will be allowed to stir too deep of fears. Emerging markets will see a bigger swell in Wednesday’s session, but the Indian 2Q GDP reading finds USDINR already marked by volatility. Top listing overall for the next 24 hours from my perspective will be the US-based consumer confidence survey from Conference Board. The University of Michigan’s measure unexpectedly collapsed to a 10-year low amid concerns of inflation and a resurgence in Covid. With the Fed talking taper, this report will take on greater importance in measuring how Americans feel about the economy going forward and whether taking the punch bowl away would be a disastrous move now. That said, don’t forget we have NFPs later this week, which is a direct component of the dual mandate.
Consumer Confidence Index from the Conference Board (Monthly)
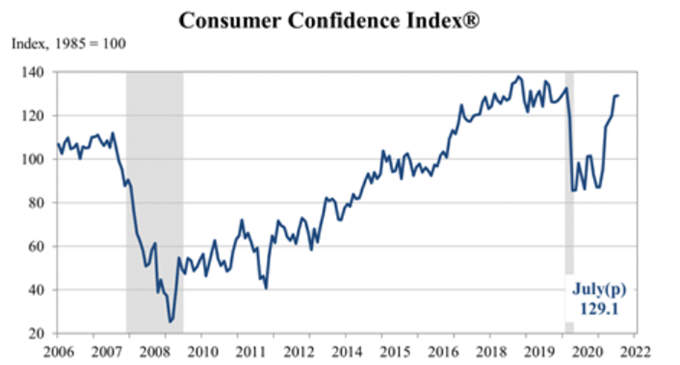
Chart Created by Conference Board
With the US event risk topping my list for event risk, I’ll be watching the Dollar to see if its can muster any action from the update. I like to look for both bullish and bearish options so an unexpected outcome doesn’t necessarily leave me sidelined in all but one scenario. If the data is poor such that growth and interest rate expectations fade, I’ll be watching EURUSD and AUDUSD for anti-Dollar follow through given they have both already tentatively broken trendline resistance. In the former’s case, breaking above the 50-day moving average would be good signal of continuation. A side note, watch for the Eurozone CPI that is due in the European session as that can leverage or dampen the market response to the US data.
Chart of EURUSD with 50 and 100-Day SMAs (Daily)
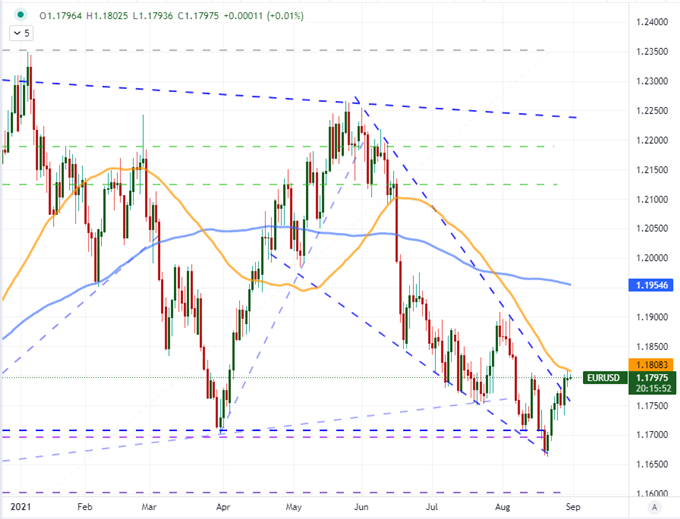
Chart Created on Tradingview Platform
Alternatively, a Dollar rebound would be best served by a cross that has not yet fully broken like the aforementioned EURUSD but is also exhibiting some volatility so that any swings could find more promise for distance. USDCAD fits the bill well here. While some may say that the pullback recently has perhaps edged below rising trendline support, the hold above 1.2600 as a long-term Fib and the collection of Fibs further down looks like it still stands as backdrop. Should the Dollar rally – and the loonie have a poor reaction to June and 2Q GDP data – this would seem to have potential up to the 1.2700 range readily and scope for more if bulls really lean into volatility.
Chart of USDCAD with 50, 100 and 200-Day SMAs (Daily)
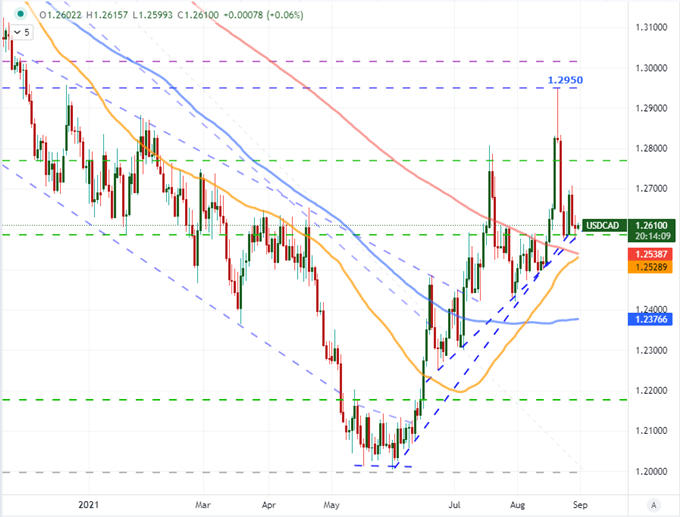
Chart Created on Tradingview Platform


