


Dow, Dollar, Yields, EURUSD and USDCAD Talking Points:
- Through the US indices (S&P 500, Dow and Nasdaq) closed at fresh record highs Monday, risk trends were not experiencing a unified momentum
- Event risk for Tuesday centers on the start of US earnings – JPMorgan and Goldman Sachs – but US CPI is the top of my list
- Fed policy standing is critical to watch with the US inflation report, but monetary policy is very much a global theme this week with ‘risk’ implications

A Slow Start to the Week Speeds Up Quickly
This week started off as if we are in the ‘summer doldrums’, which is technically true. There is good reason to suspect that the markets are going to measured in their movements – particularly when the bearing remains bullish. Yet, while we may not be establishing a market-wide seismic shift for the global financial system, there is still plenty of risk for narrow or broad volatility. That is especially true with economic docket that we have ahead, loaded with events that can spin up volatility-inducing fundamental themes. Much of my attention will be on US interest rate forecasts around data like Tuesday’s CPI, but this theme could very readily turn into a global issue with a host of key policymakers slowly shaping the fabric of monetary policy as a baseline for speculative reach. And, we are certainly reaching. Through Monday’s close, the S&P 500, Dow and Nasdaq 100 all closed out record highs.
Chart of the Dow Jones Average with 100-Day Moving Avg and Spot-MA Disparity (Daily)
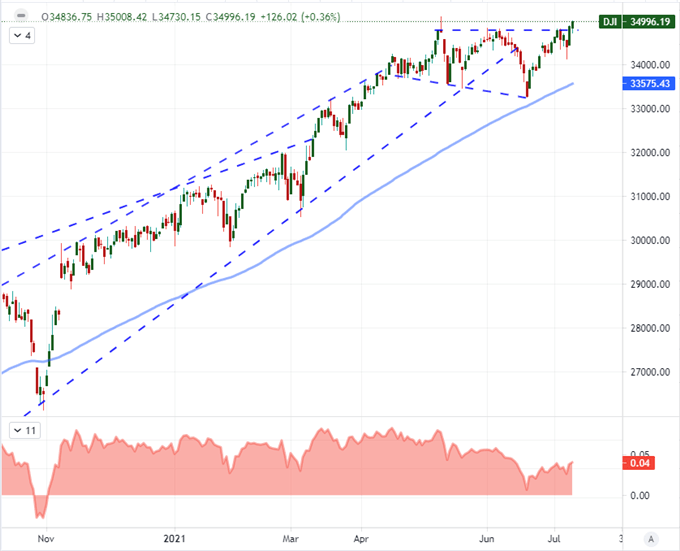
Chart Created on Tradingview Platform
While the US equity markets were shambling higher like zombies, the hollow confidence wasn’t exactly shared across the entire market. Germany’s DAX 30 index closed a record high itself; but other indices like the FTSE 100, Nikkei 225 and ASX 200 were simply holding to range-based churn. Outside of equities, there remains a clear struggle for some of the other asset classes I monitor for general sentiment such as emerging markets, carry trade, junk bonds and commodities. I consider risk appetite to be the single most influential element in the markets, so until I see the various speculatively-driven markets tighten up their correlation and put some pace on their movement, I will remain dubious of how productive individual moves will prove. For a theme like the start of US earnings, I’m skeptical of its full ‘risk’ reach. Financials from JPMorgan and Goldman are important reflections of banking, negative rates and buyback activity for late-stage rallies; but that is likely to hold more influence with the Dow than Nasdaq 100 – much less further corners of the financial system.
Chart of Relative Performance for Risk Assets (Daily)
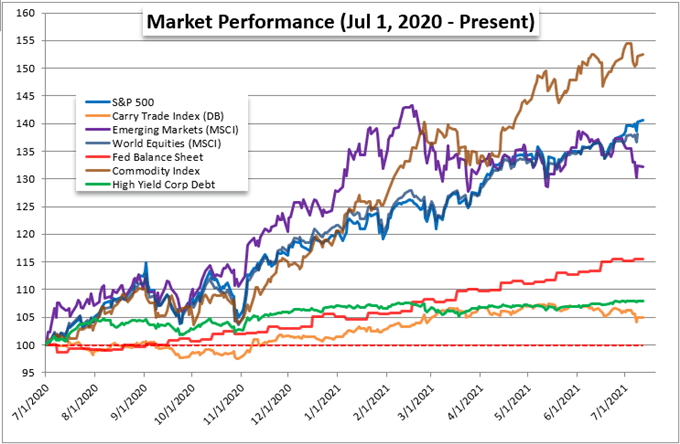
Chart Created by John Kicklighter with Data from Bloomberg
Top Event Risk for Tuesday: US CPI
There is little doubt in my mind that the top event on tap for potential impact will be the June US Consumer Price Index (CPI). The market’s favorite inflation indicator has advanced quickly and charged Fed rate speculation. Last month’s reading was an exceptional 5.0 percent headline annual pace of growth which is far beyond the central bank’s 2 percent target. The ‘transitory’ language the central bank has used to describe this period of painful pressure wears thin the longer it takes for these series to normalize. That in turn draws the market’s attention in interpreting the options for the US central bank. On Monday, the New York Fed’s consumer inflation expectations index only added to the anticipation. The most recent reading swelled to 4.7 percent which was the highest since the data has been collected. A surprise to the downside could be market moving for the Dollar, but persistent higher inflation could be the bigger weight for general risk trends. Below, I have a chart that shows the effective yield of high yield fixed income (from ICE BofA) as a reminder that there is a negative real rate of return on these most risky of assets.
Chart of US CPI with ICE’s High Yield Index Effective Yield (Monthly)
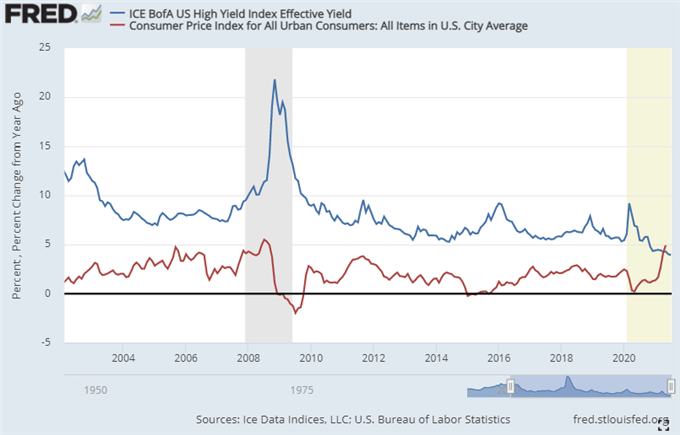
Chart of from FRED Fed Economic Database with Data from BLS
For the Dollar, the higher inflation reading from Monday’s lead in didn’t seem to offer too much reliable lift. The trade-weighted Dollar Index was indeed higher on the day, but there was little progress to be made after a two-day tumble, which could have been technically ‘easier’ to reverse. The individual Dollar-based majors showed even less impressive technical response to the fundamental current. Nonetheless, we did see a positive correlation with the US 10-Year Treasury yield and implied interest rate forecast from Fed Funds futures which is unusual lately. The latter is once again pricing in approximately 19.5 bps worth of tightening through the end of next year.
Chart of DXY Dollar Index with 20 and 100-DMAs, Implied Fed Rate Hike Through 2022 (Daily)
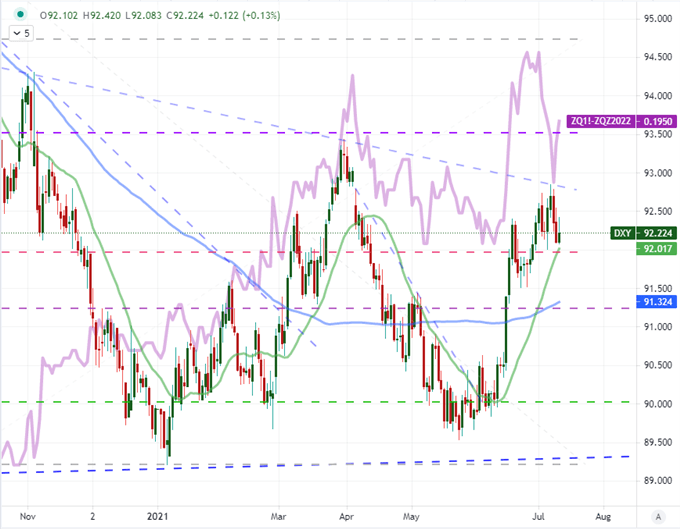
Chart Created on Tradingview Platform
Monetary Policy is a Global Consideration
While the focus of the economic calendar and scheduled event risk will be explicitly centered on the US monetary policy balance, this is very much a global consideration. There are four high-profile central bank rate decisions this week, and a swell of speculation is building that a broader hawkish shift is more imminent than it has been at any time since the pandemic struck. All of this is volatility cannon fodder for the local currencies (Canadian Dollar, New Zealand Dollar, Turkish Lira and Japanese Yen), but collectively it gives the picture of universal policy. At the very least, it will put into greater contrast the standing of the Dollar and the Fed’s course moving forward.
Chart of Relative Monetary Policy Standing of Major Central Banks
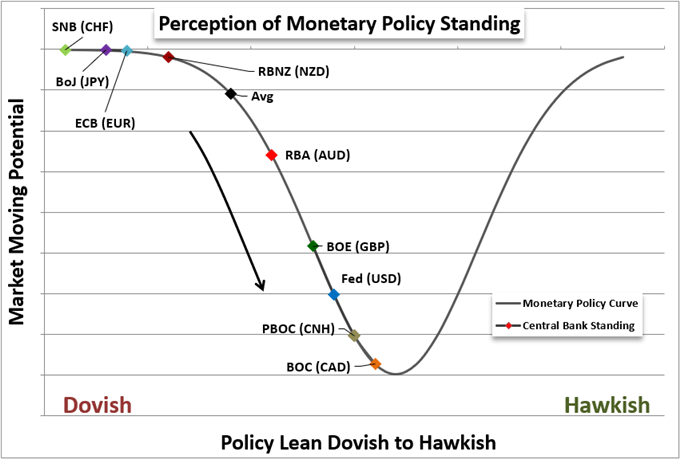
Chart Created by John Kicklighter
Though the ECB is not officially on tap for this week, its President, Christine Lagarde, ramped up interest in the next policy gathering next Thursday (July 22nd). Madame Lagarde insinuated after the gathering of G-20 Finance Ministers and Central Bank Governors this past weekend that there substantial changes coming in this month’s policy decision. That may just be an update on guidance following last week’s strategy report, but her remarks that “interesting changes” are forthcoming could be interpreted as much more. As it stands, EURUSD, EURGBP and EURJPY registered limited response to this potential; but as monetary policy picks up as a theme this week, keep mind of the second most liquid currency.
| Change in | Longs | Shorts | OI |
| Daily | -1% | -4% | -3% |
| Weekly | 4% | -10% | -5% |
Chart of the EURUSD with 20 and 100-Day Moving Averages (Daily)
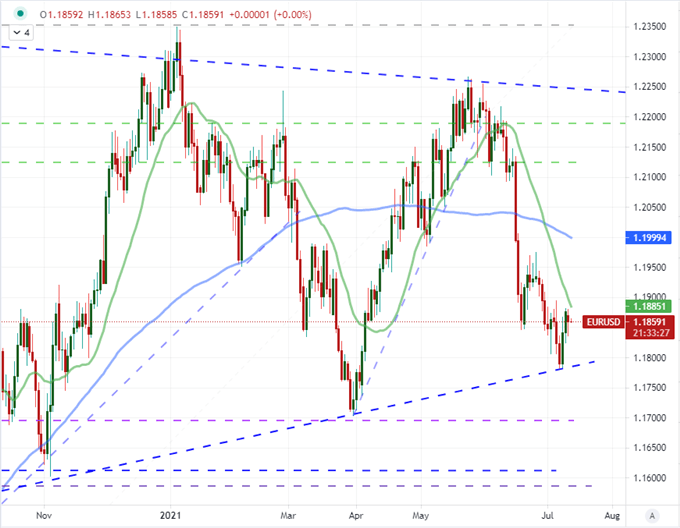
Chart Created on Tradingview Platform
While hawkish anticipation for the RBNZ with the local housing market growing ever greater a concern for economic overheating, my attention just beyond the 24 hours horizon is more distinctly focused on the BOC rate decision on Wednesday. After their first taper on monthly asset purchases a few months, there has been a steady rumbling that a further reduction could come anytime. What makes the scenario analysis more worthwhile here, however, is the technical picture of USDCAD. We broke a post-pandemic descending trend channel resistance earlier this month, but the effort naturally lost momentum after liftoff. Now we are hemmed in between the 100 and 200-day moving averages with a fundamental spark that can help resolve the dispute. My preferred opportunities are when fundamentals and technicals converge (especially if they suit prevailing market conditions).
| Change in | Longs | Shorts | OI |
| Daily | -2% | 7% | 5% |
| Weekly | -30% | 38% | 13% |
Chart of the USDCAD with 100 and 200-DMAs, COT Net Speculative Futures Positioning (Daily)
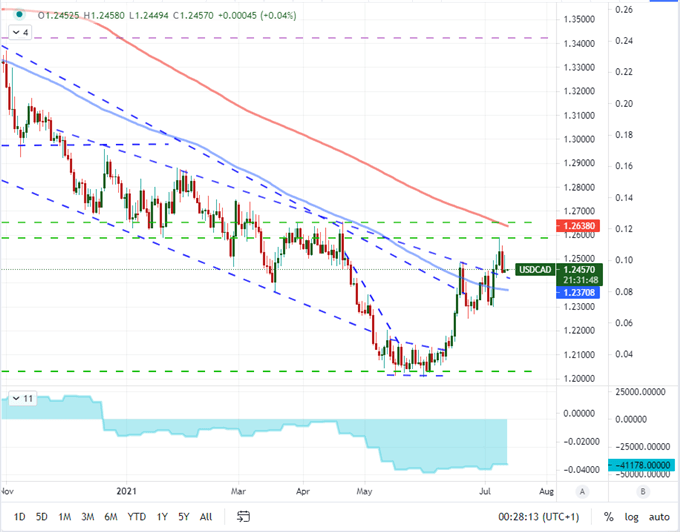
Chart Created on Tradingview Platform

.


