


S&P 500, VIX, Dollar, USDJPY, EURUSD and GBPUSD Talking Points:
- Despite a tremble in risk trends this past week; the S&P 500, Dow Jones Industrial Average and Nasdaq 100 will all start the new week at record highs
- US rate forecasting will lead the my fundamental concerns in the week ahead with US CPI and Fed Chairman Powell testimony on tap for guidance
- Central bank rate decisions (BOC, RBNZ, BOJ and Turkey), China 2Q GDP and the start of US earnings will represent additional top themes ahead

A Brief Wobble but Ultimately ‘Risk On’
We were dealt a modest ‘risk aversion’ scare this past week; but inevitably, we are set to enter the new trading week with the US indices pushing record highs. There was little mistaking the slump in sentiment this past week as it spanned the global and the many different asset classes across the globe. However, against a backdrop where market conditions are frustratingly restrictive, committing to a controversial reversal in a 16-month bull trend is a more significant commitment than the speculative rank may be capable of giving into. The relentless drive higher is no doubt a finite effort given the extravagant divergence in assets relative to their underlying value. However, bursting a bubble built upon leverage can take longer than many believe is possible. ‘Complacency’ is the setting I attribute to these markets, and that measured but relentless climb override otherwise troubling fundamental developments. Caution is warranted, but a proactive lean against the prevailing trend is a risk I’m not willing to take. Instead, I’ll wait for the critical technical breaks and the overt fundamental driver.
Chart of the S&P 500 with 50-Day Moving Avg and Daily Change (Daily)
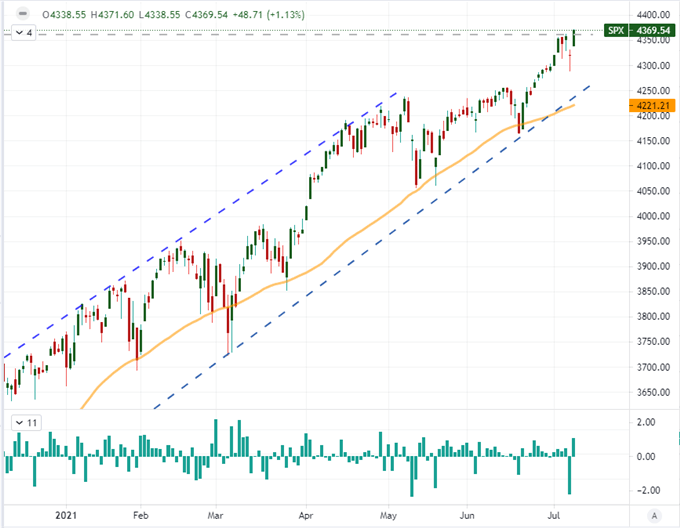
Chart Created on Tradingview Platform
The Top Potential Market Moving Theme Is Once Again Monetary Policy
Moving into a new trading week, I am cognizant of the expectations for market seasonal market conditions. We are moving further into the month of July with a history of settling into ‘summer doldrums’ through this period. There is certainly evidence that this norm is on tap once again and it is conforming to the steady systemic slide in speculative appetite that is the result of the moderating tempo of a post crisis recovery. The reality that the neck-break pace cannot continue forever is already sinking in, but speculative lift seems more contingent upon what structural changes will result amid the moderation. In particular, the intention of the world’s largest central banks to start withdrawing from their extraordinary exposures is a top concern. There is run of high profile monetary policy related events on tap over the coming week. If these deep-pocketed buyers continue to transfer risk onto the open market, the weight of exposure will disrupt conviction.
Chart of Relative Monetary Policy Standing of Major Central Banks
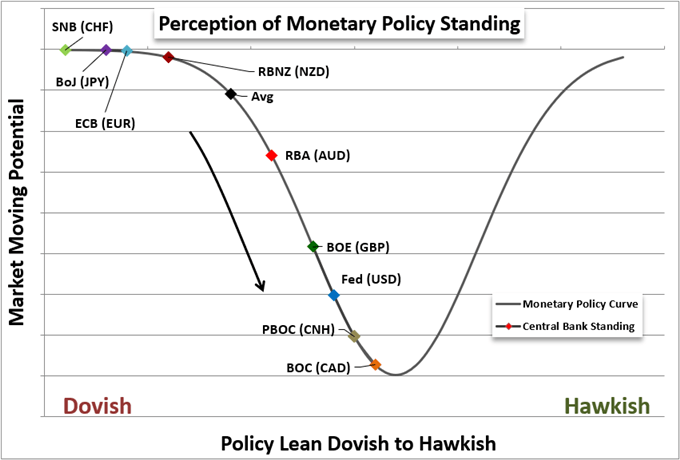
Chart Created by John Kicklighter
For the world’s largest economy and currency, there is no official rate decision on tap. The Federal Reserve’s next monetary policy decision is not until July 28th. That said, the market doesn’t need official action from these authority to direct its own collective speculation. Through the end of the past week, the tumble in 10-Year Treasury yields and implied Fed rate hikes (derived from Fed Funds futures) found some modest reprieve with a Friday rebound. The Dollar on the other hand didn’t get the memo. Ahead, speculation will find more tangible milestone upon which to speculate. Top data is Tuesday’s consumer inflation (CPI) update for June, which is the market’s favorite price gauge. I will also be reading through Fed Chairman Powell’s remarks Wednesday as he testifies on the US economy to the House of Representatives. There is particular influence to be found in US monetary policy as it is most readily registered as a global influence of all its peers.
Chart of DXY Dollar Index with Implied Fed Rate Hike Through 2022 (Daily)
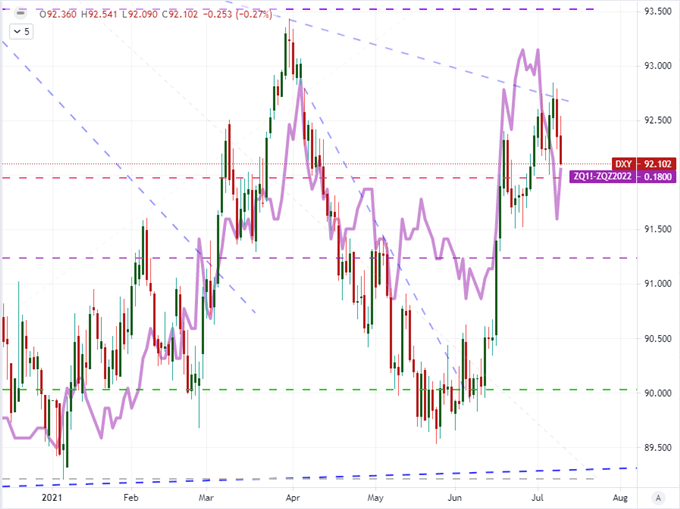
Chart Created on Tradingview Platform
A Few Top Pairs to Watch Next Week
While the Dollar’s innate influence makes it a must-watch over at any time, there are other assets that carry significant fundamental charge in the week ahead – perhaps enough to translate into a global influence. Once such stealthy risk is the Canadian Dollar and the scheduled release of the Bank of Canada rate (BOC) rate decision. There are a number of high profile monetary policy updates due over the coming week, but this one in particular can alter the course of policy expectations the world over. That is because it was one of the first major central banks to make an obvious effort to taper its extreme, post-pandemic stimulus effort. Back in April, the BOC announced it would taper its weekly asset purchases. The news led to a stiff Canadian Dollar rally that led USDCAD all the way down to long-term support at 1.2000. We have reversed since then, but if the group decides to lay out another move to withdrawal its exceptional support, the pacing will be difficult to miss. The 1.2400 level is a more immediate support, but the figures on the monthly chart will be held in the back of my mind.
| Change in | Longs | Shorts | OI |
| Daily | -2% | 7% | 5% |
| Weekly | -30% | 38% | 13% |
Chart of the USDCAD with 100-Day Moving Averages (Daily)
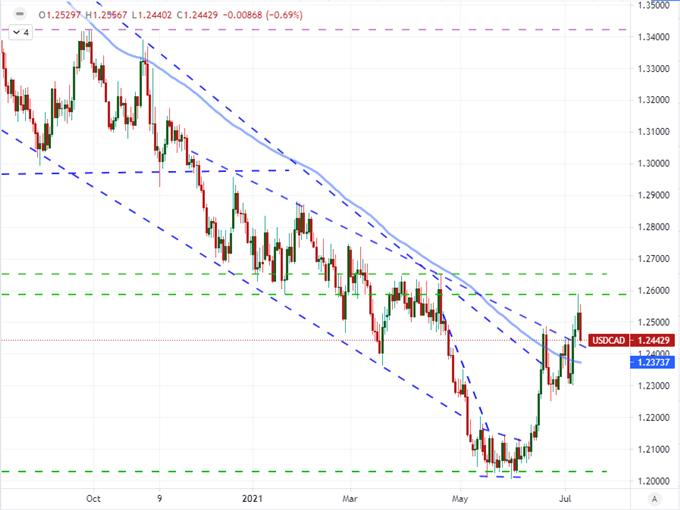
Chart Created on Tradingview Platform
Over the coming week, there will be three other major central bank policy meetings that are on my radar. The Bank of Japan (BOJ) and Reserve Bank of New Zealand (RBNZ) represent currencies and economies on the opposite ends of the spectrum. The former is a ‘funding currency’ and a policy authority that has been mired in extreme accommodation for more than three decades. The potential for change is low. The RBNZ on the other hand represents a currency that is considered a major owing to its higher relative yield making it a ‘carry currency’. If the group were to change its tone and suggest a taper or hike were possible, it could lead to a significant rally in these extremely low yield times. Yet, that is also a low probability. One of the most loaded of the major central bank decisions will be the Turkish Central Bank rate decision. Back in March, the country’s President removed the previous governor because he felt interest rates were too high. Despite that time frame, his replacement has yet to ease the onerous benchmark. Is this an attempt to curb the Lira’s depreciation? I’ll be watching USDTRY closely.
Chart of the USDTRY with 100-Day Moving Average (Daily)
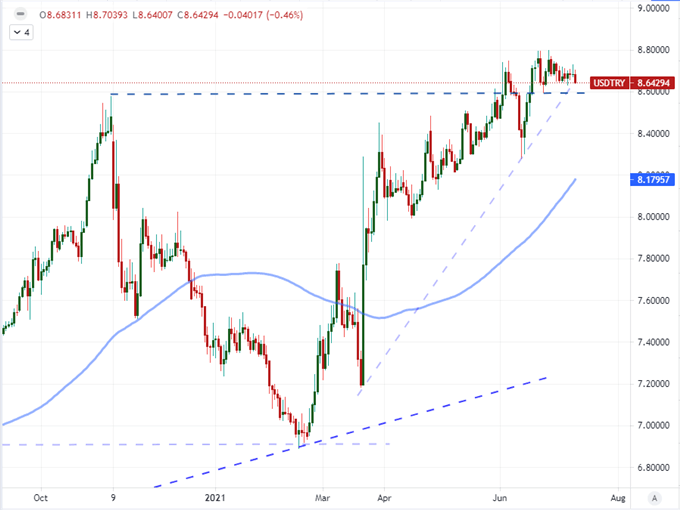
Chart Created on Tradingview Platform
Outside of monetary policy there is plenty of scheduled event risk that can rouse localized volatility. Australian and UK employment are two figures of significant influence as is the US retail sales report due Friday. Yet those are not likely to exert influence beyond their local currency and capital markets. A theme with a little more reach will be the start of US earnings season with some of the key banks due to report their stats. While the health of Corporate America can have far-reaching implications, it is likely far too early into the season to show a global impact – unless the numbers are particularly bad. For a global footprint, the China 2Q GDP reading will start the ball rolling on the quarterly growth prints. We have seen some moderation in growth readings as of late (such as from the ISM June figures), so these official figures will be scrutinized more closely. That said, China’s figures have a habit of not deviating far from the economist forecasts. Nevertheless, USDCNH will be on my watch list this week along with AUDUSD.
Chart of the USDCNH with 200-Day Moving Average (Daily)
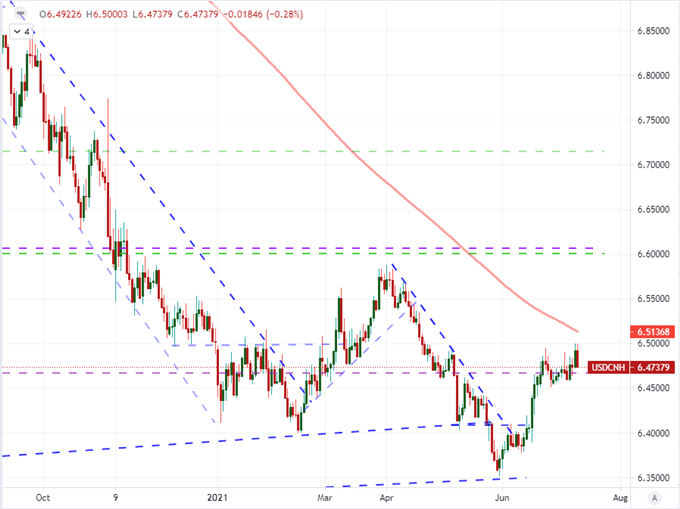
Chart Created on Tradingview Platform

.


