


S&P 500, Dollar, USDJPY, GBPUSD, Dogecoin and Earnings Talking Points:
- Markets opened to broad – if restrained – risk aversion to start the week with the S&P 500’s -0.5 percent drop the biggest in 18 trading days
- The Dollar dove Monday and in turn cleared the midpoint of the 2021 range to this point as both risk appetite and US yields weigh
- Dogecoin remains the most charged speculative banner heading into Thursday while earnings will pick up as a theme between NFLX, CSX, JNJ and others

Liquidity and A Common Cause Still Undermining Risk Trends
The new trading week started off with a fairly broad retreat from risk-leaning assets. Given the restraint from last week, the seasonal assumptions of volume and volatility in April as well as the lack of a clear fundamental motivation; the slip shouldn’t come as a shock. Yet, as benchmarks like the S&P 500, Dow and Nasdaq 100 all back off of record highs, we shouldn’t read too much into the intent of the tack. It is tempting to always draw conclusions of intent when eagerness for a quick trade with ideal entry point overrides our practical interpretation of what is actually unfolding in the market. More remarkable in my estimation is the ‘structural’ shift in speculative turmoil. Having played out the sharp recession and subsequent recovery with generous stimulus as well as ambitious growth forecasts, markets progressed through opportunism to pricing a virtual ideal outlook. That won’t necessarily capsize the bull trend, but it is more likely to curb enthusiasm via the tempo of the advance.

Chart of S&P 500 with 100-Day Mov Avg and 1-Day Rate of Change (Daily)

Chart Created on Tradingview Platform
In the past few months, the concept of a rising speculative tide lifting all boats has given way to the more concentrated appeal of preference to assets that have a unique fundamental advantage or which already enjoy momentum to sate the average investors’ appetite. Notably, there wasn’t the telltale partiality for either disruptive tech or volatile small cap names in the US equity market relative to the big benchmarks (ie Nasdaq to Dow or Russell 2000 to S&P 500). The Reddit boards and FANG members may be in holding patterns – the latter awaiting earnings – but there was one area of full speculative indulgence: cryptocurrency. While Bitcoin and Etherium have corrected against their 2021 bull trends over the weekend, Dogecoin managed to extend its run after a Saturday swing lower. Reports of the Biden Administration mulling early stages of regulatory guidance on crypto blended with news the PBOC swung back in favor of ruling that asset class a speculative market rather than total band. Yet, through it all DOGEUSD recovered its lift Monday and was once again trading back towards 0.45. Keep tabs on this very forward operating signal for risk taking.
Chart of the Dogecoin DOGEUSD and 100-Day Moving Average (Daily)
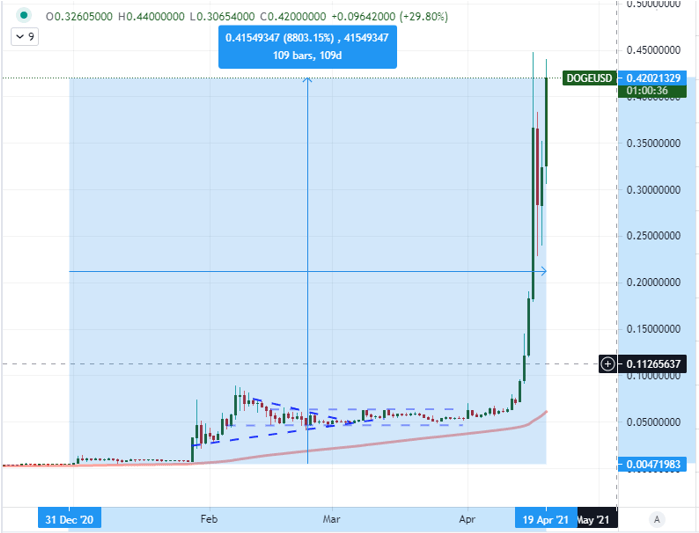
Chart Created on Tradingview Platform
Back to Grounded Fundamentals
While I attempt to always be practical in reading market sentiment where it currently resides (seemingly at the fringe seeking outsized returns against the backdrop of central bank policy), it is important to track fundamental themes that can reasonably take over for direction. We have seen growth forecasts and monetary policy assurances come and go, but now is the time of US corporate earnings. I believe it is a lower probability that these statistics will steer global risk trends to a significant revival of trend, but certain updates could broach different themes. Three tickers that I will be watching Tuesday (after the close) are: NFLX, CSX and IBKR. The most popular of the listings will be Netflix which is one of the fading starts of the FANG group. CSX reflects more meaningfully on economic activity as a major shipping company that tracks production and demand. As for Interactive Brokers, the rise of retail interests has focused our attention on the likes of Robinhood and Coinbase, but this is an established broker.
Chart of Netflix, CSX and Interactive Brokers (Daily)
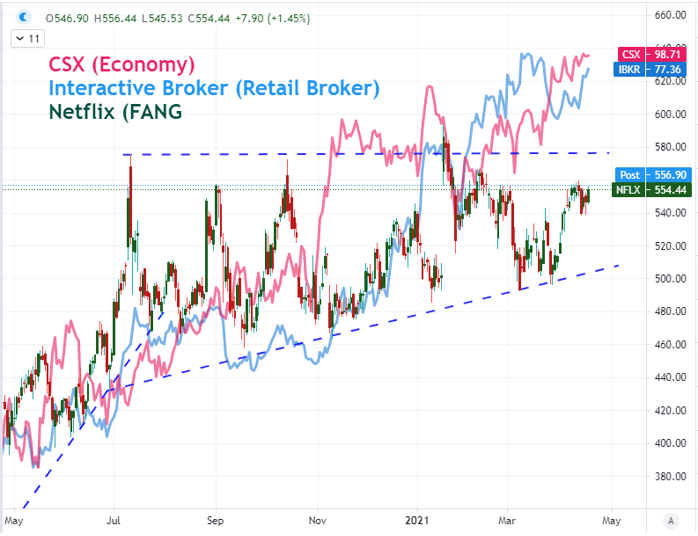
Chart Created on Tradingview Platform
As for fundamental themes, the Greenback seems to have found significant alignment from two of its principal themes of late. The US 10-year’s peak and slow retreat from the 1.77-peak on March 30 happens to align to the DXY Index’s own top (not to mention the fade in implied Fed Fund rate intensions derived from futures). Then there is the correlation to traditional risk assets. While the S&P 500 did drop this past session, its general bullish course seems to hold a strong negative correlation to the US currency (-0.80) over the past trading month even though I doubt there is much haven premium built into the benchmark. While they have been moderate influences individually, their collective charge seems to have been enough to push the DXY below its 50-day moving average Monday on the open and pressure the 100-day moving average through early Tuesday trade.

Chart of DXY Dollar and 100-DMA, Implied Fed Rates, US 10-Year with Correlation (Daily)
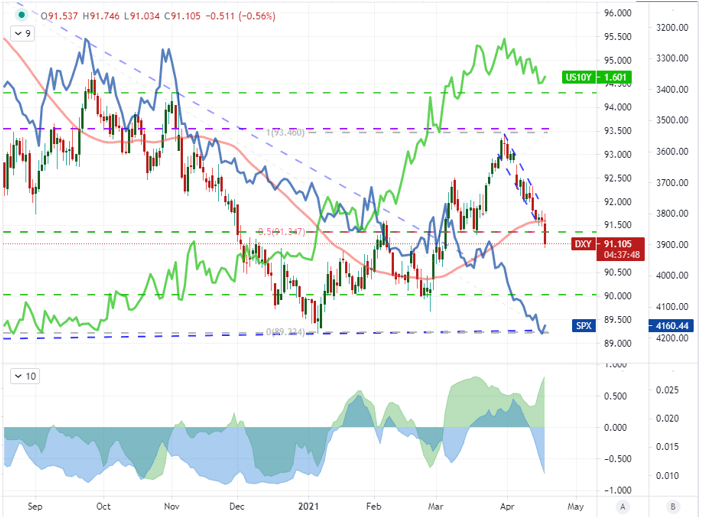
Chart Created on Tradingview Platform
Impressive Technical Breaks from the Majors
With the trade-weighted Dollar index breaking lower, there are bound to be some interesting charts among the currency’s crosses. While there are some interesting minor crosses like USDINR still showing volatility (and favor for the Greenback) while USDBRL and USDMXN looks to follow USDZAR into a technical break lower, the majors seem to be presenting more remarkable technical snapshots. While EURUSD is less than impressive in its move higher, USDJPY has clearly defined levels that are being breached and holding up momentum in turn. Having broken 108.60 to start the trading week we are now facing the 50-day moving average close to 108 and the 38.2 percent Fib retracement of the 2021 bullish drive falling around 107.75.
Chart of USDJPY with 50-Day Moving Average (Daily)

Chart Created on Tradingview Platform
In other Dollar-crosses, there are key technical levels in sight, but their influence comes into play if/when the Dollar actually gains ground. Examples of this are AUDUSD and its head-and-shoulders neckline at 0.7565 and USDCAD with a channel around 1.2600. As appealing as those technical milestones are, it requires a reversal in prevailing conviction to accomplish. In contrast, a mix of Dollar weakness and recent Pound strength has pushed GBPUSD to break through near-term congestion in a multi-week wedge pattern to trade into a large range (up to 1.4250) while still abiding the longer-term bullish bias. This looks much more like a ‘path of least resistance’ resolution that keeps in check intentions for unrealistic prominent trends.
Chart of GBPUSD with 100-DMA and 1-Day Rate of Change (Daily)
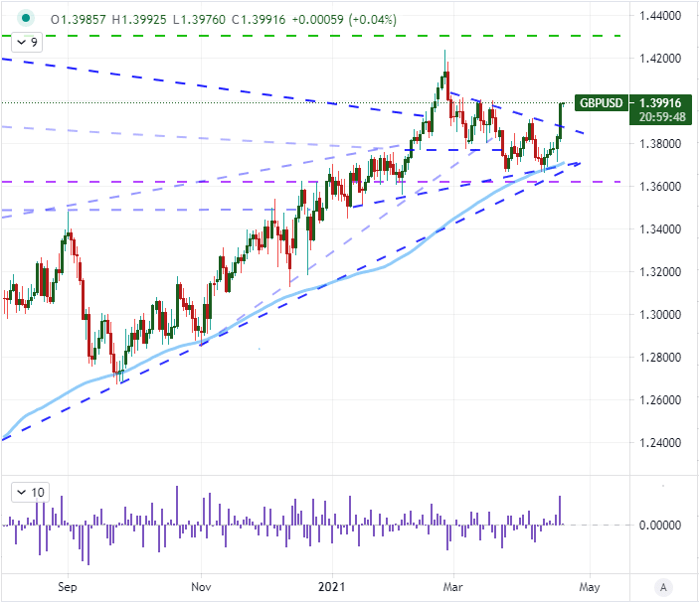
Chart Created on Tradingview Platform


