


S&P 500, US Dollar, USDJPY, GBPUSD and USDCNH Talking Points:
- Though the S&P 500 ‘broke out’ from the smallest daily range in 16 months, the technical event didn’t encourage run as 3-day ATR still smallest since December 2019
- As the strong growth figures fade without a significant market impact, attention may return to yields and inflation, financial stability reviews and US-China talks
- The Dollar finds itself at the core of so many of these themes which makes for important fundamental reflections for USDJPY, USDCNH, GBPUSD and USDCAD

A Breakout With Absolutely No Enthusiasm From the S&P 500
As expected, the S&P 500 managed to force a breakout this past session. What’s more, the technical event tagged a fresh record high for one of my preferred ‘risk’ measures. If that were all we knew, we could draw some seriously enthusiastic conclusions about the state of the market. Yet, when we evaluate the situation from the chart and consider the disconnect from the heavy fundamental seas this week, the picture is rouses more concern over what’s ahead than the fact that we are pushing a second consecutive record high day just shy of 4,097. That is because the occasion of the break results in an extremely restricted (0.4 percent) advance with just as little active range as the preceding two sessions. Overall, the three-day activity levels (ATR as a percentage of spot) is still the lowest since holidays 2019 and really only comparable to the extreme quiet back in 2017. Further, this is the market picture we are presented with the back of a week that has been loaded with news of nearly a million added jobs in NFPs, the service sector running at a record pace, the IMF’s growth outlook at a pace not seen since 1984 and a vaccination program well ahead of the ambitious objective.

Chart of S&P 500 with 100-Day Mov Avg and 3-Day ATR as Percentage of Spot (Daily)
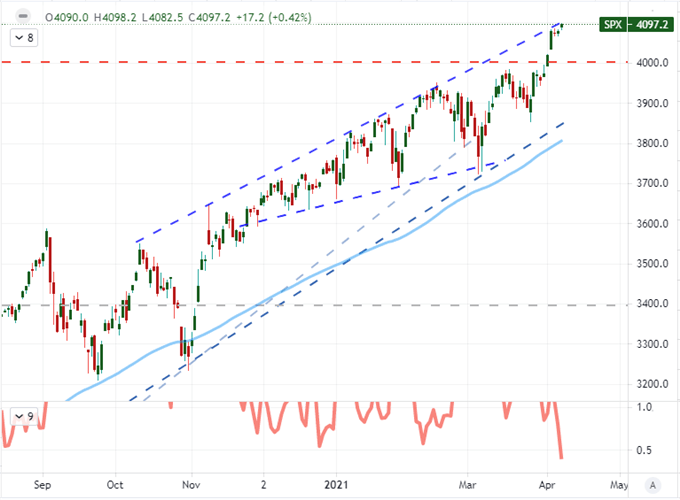
Chart Created on Tradingview Platform
With such a strong fundamental backdrop, it would be easy for investors to accept a persistent climb higher with further reinforcement of the stimulus-bred complacency of the past decade. Alas, that is not happening. While perception of risk measured through means like the VIX volatility index are pushing lower, the actual concerns of the market may run deeper with considerations of markets that have overrun their relative value, the growing drum beats of a revived US-China trade war, concern that stimulus will be forced withdrawn and even the practical fading of interest from retail participants (which the industry calls ‘dumb money’). A survey from broker Charles Schwab found that nearly 15 percent of the current retail investors began trading in 2020. Further, among those new traders, appetite for short-term trading dropped from 44 percent of respondents last year to 28 percent in 2021.
Chart of VIX Volatility Index Overlaid with Inverted S&P 500 (Daily)
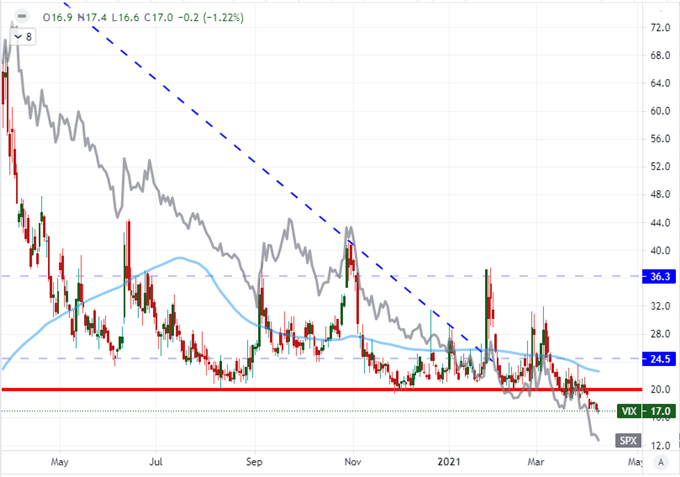
Chart Created on Tradingview Platform
Another mixed influence for the markets in which we are struggling to find conviction is the seasonality considerations. Alongside the drop in volatility mentioned above, we have also seen total volume in US equities has dropped to its lowest level of the year – both typical occurrences from a seasonality perspective. In turn, those are conditions expected to contribute to another norm: the largest average monthly gain on the annual calendar. At present, however, there is not much of a case to be made around a discount. Instead, these markets read as particularly stretched and founded on a structure of temporary supports.
Chart of Historical S&P 500 with Volume and VIX Performance Per Month
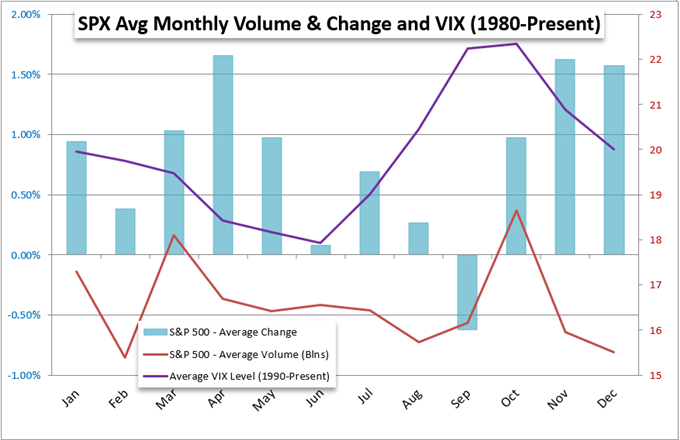
Chart Created by John Kicklighter with Data from Bloomberg Terminal
Transitioning from a GDP Focus to Lingering Issues
As the run of remarkable growth readings fades into the backdrop with little traction to show for the record breaking data, the markets will either struggle for direction among numerous drivers pulling different areas of the market or we will come across the next active theme. There are a range of issues in the backdrop, but the top concern from a Twitter survey I conducted and a Bank of America questionnaire run by fund managers was the uncertainty around yields and rates. That is a particular magnet for the Dollar in my view. It also aligns nicely to the fact that both the US 10-year Treasury yield and Fed Funds futures implied rate forecast (now 17.5 basis points of tightening through 2022) slipped alongside the Greenback. The currency seems to be tied into its carry status rather than its haven appeal.

Chart of DXY Dollar and 100-DMA, Overlaid Fed Funds Dec 2022 Forecast and US 10-Year (Daily)
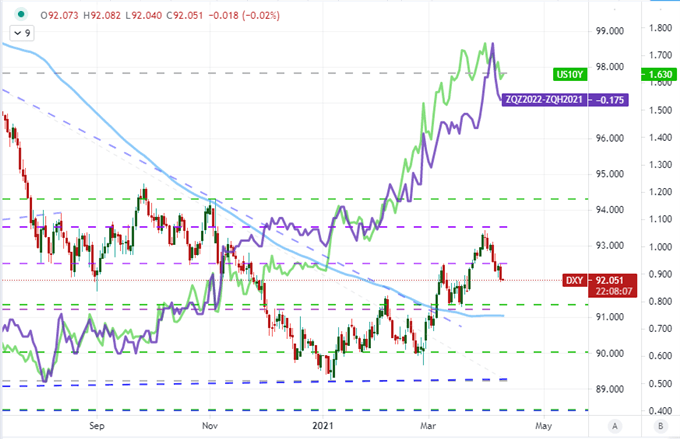
Chart Created on Tradingview Platform
Pairs to Watch as the Dollar’s Slide Faces Technical Boundaries
With the Dollar as a base currency, the perspective on the market can shift to focus on particular aspects of the financial system depending on the counterpart. USDJPY for instance can help focus the perspective of risk trends founded in yield forecasts. Both the Dollar and Yen are haven currencies generally, but the most hawkish outlook among the majors at this point seems to be the Fed. With yields pulling back while the sentiment remains uneven, the slide to 109 makes sense. With Thursday’s drop, the pair closed below its 20-day moving average for the first time in 54 trading days – the end of an intense run.
Chart of USDJPY with 20-DMA and Spot-20DMA Disparity (Daily)
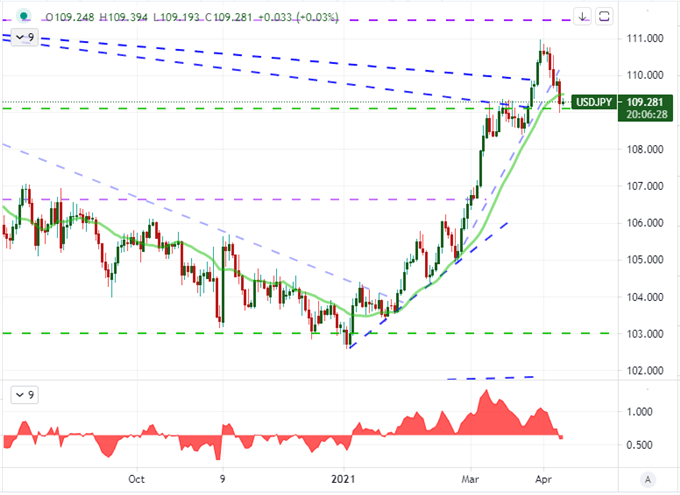
Chart Created on Tradingview Platform
Meanwhile, the Dollar seems to be weighing a bullish outlook from the very beginning of a turn after an exaggerated consolidation on USDCNH. This past session, it was reported that a bill has been proposed in the Senate looking for bipartisan support in pushing a clear agenda in countering China’s spreading influence alongside perceived anti-democratic practices and unfair trade practices. If this gains traction following the troubled summit in Alaska, a return to the trade war drive is likely.
Chart USDCNH with 20-Day and 200-Day Moving Averages (Daily)
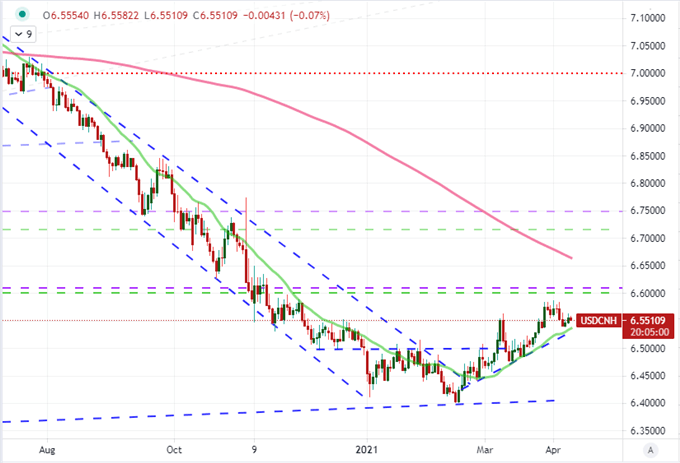
Chart Created on Tradingview Platform
For pure event risk and short-term volatility potential, I will keep an eye on USDCAD through Friday. The Canadian employment statistics were delayed by the holiday last Friday – unlike the US data – and the backdrop of the pandemic will leverage interest. This pair failed to make something out of a long-term descending trend channel resistance breach, but perhaps a data point like this can help it along. Of course, if the data is robust, a strong push back into range would be more reasonable an accomplishment for an end-of-week release than trying to solidify a massive trend reversal.
Chart USDCAD with 100 DMA (Daily)
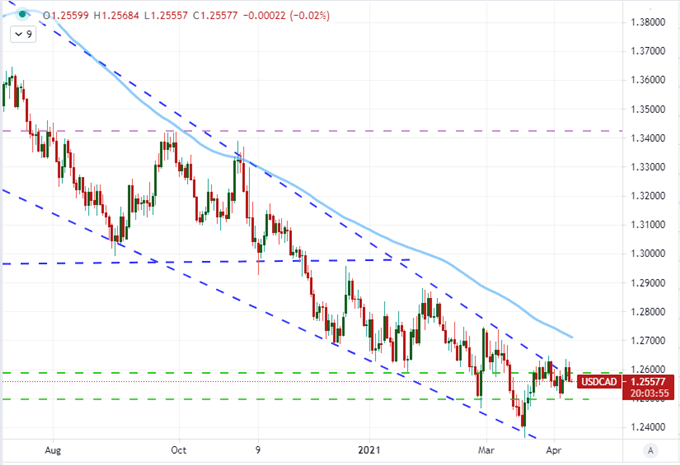
Chart Created on Tradingview Platform

.


