


S&P 500, Nasdaq, US 10-Year and USDJPY Talking Points:
- The S&P 500 managed to overtake 4,000 – a major psychological level – Thursday with many other risk-leaning indices and assets edging higher in support
- Liquidity will be the defining feature of the landscape Friday with a holiday drain through NFPs and a significant portion of the world offline through Monday as well
- Risk trends is the core fundamental consideration ahead, but traders would do well to watch growth forecasts, rate speculation and vaccination data into next week

Risk appetite closed out this past week with an important technical development that would leave speculative appetite charged despite the disruptive drain in liquidity across the financial system. Though technically, there are a range of markets (such as global FX) that are open through Friday this week, core Western world fields such as the US equity market would be deflated early for the holiday weekend. With this market distortion ahead, the S&P 500 was under pressure to make critical technical progress before the extended closure or risk sacrificing the potential stored up behind bullish interests for months. Despite having every fundamental reason in the world to level out and take up the difficult decision again when April liquidity started in earnest, the SPX cleared 4,000.
This massive psychological number will draw considerable interest throughout the markets with headlines trumpeting the jump and anticipatory orders being tripped. As for the technical quality of the move, the open of the past session’s candle was the low and the close was the high with a healthy 20 point buffer clearance of the round figure. That will go a longer way in reinforcing the standing come Monday’s open. Of course, this milestone alone will not ensure the next leg of the larger trend. Growth, yields, financial stability and the coronavirus globally can abruptly change assumptions should the current change.

Chart of S&P 500 with 100-Day Moving Average (Daily)
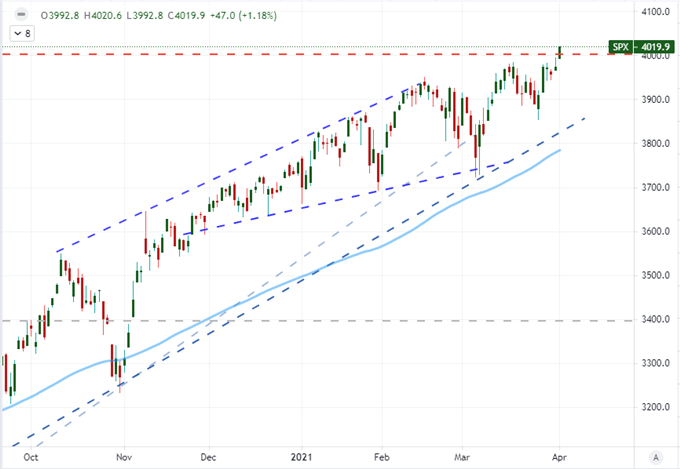
Chart Created on Tradingview Platform
On the technical side of things, the dying hours of full trade through the Western world offered up more than just a bid for US indices. Global indices, emerging market, junk bonds, crude oil and carry trade were all feeling the buoyancy of speculative appetite. Further, fundamental justification was easy to draw from for those looking for reinforcement in their preconceived bullish bias. However, the capacity for follow through in the immediate future falls to a matter I belief falls outside of these two principal analysis techniques: liquidity. While the Western world capital market exchanges are closed through Friday, there are still areas of the financial system that are open to engender a sense of broader speculative sentiment. That will make Friday US NFPs particularly interesting.
Then, through the start of next week, the US will come back online Monday; but many developed world financial centers (Germany, France, UK, China, Australia and others) will remain offline for a full four-day weekend. What’s more, there are broader seasonal expectations that will carry through even when these regional curbs are completely passed. Historically, April sees a broad reduction in both volume and volatility (using the S&P 500 as benchmark) while speculative appetite tends to find its best overall performance of the calendar year. There will be many in the market happy to let these assumptions play out while the skeptical will carry forward the ever-loaded perspective that ‘this time is different’.
Chart of Seasonal Performance of S&P 500 with Volume and VIX
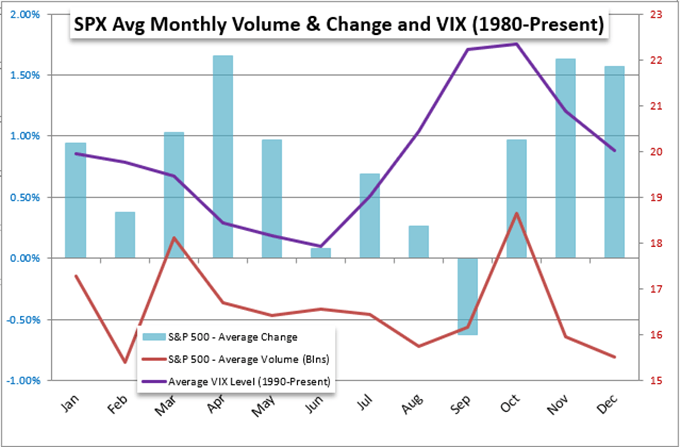
Chart Created by John Kicklighter with Data from Bloomberg Terminal
I believe that market depth is an undeniable force in the market such that conviction will be difficult to muster through Friday and/or Monday. That is not to mean that no movement is possible; rather volatility is likely to burn hot and fade quickly or developments in the systemic sense will come at a more measured pace. Major trend extensions, reversals or breakouts with follow through will be exceptionally difficult to muster. Yet, through the dip, it will be important to keep close track as to what theme or themes are exerting the greatest influence and thereby can take over when liquidity fills back out. One benchmark that is proving particularly useful in this sometimes complex overview of competing themes is USDJPY.
Through week’s end, the Yen crosses seemed to play catch up to the more sensitive risk assets with notable progress from the likes of EURJPY, GBPJPY and CADJPY among others. However, USDJPY which had cleared multi-year congestion resistance markers at 109.50 and 110.00 wouldn’t be able to extend the next mile to jump 111. The Dollar’s slip seemed to play a role here even though sentiment and data through Thursday was favorable and the Fed rate forecast extended the projected yield advantage for the pair. Tangible market yield via Treasuries, however, seemed to open a point of contention.

Chart of USDJPY with 20-Day Mov Avg, Overlaid with US 10-Year and 100-Day Disparity (Daily)
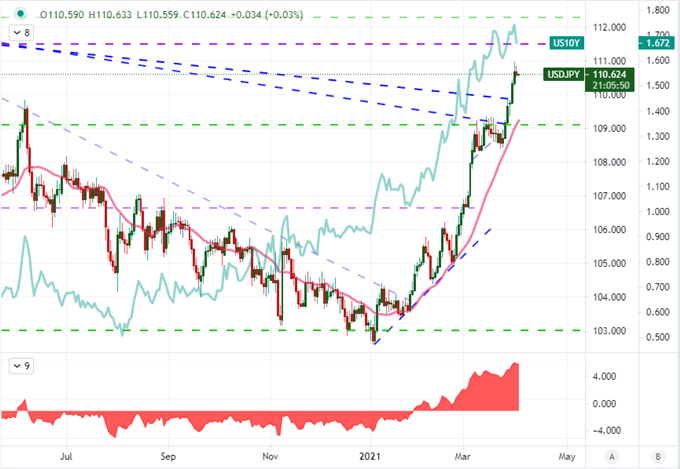
Chart Created on Tradingview Platform
For individual points of event risk ahead, there are a range of calendar updates that can potentially generate volatility – if not foster momentum for underlying trends. The most noteworthy data point on tap through the immediate future was the March nonfarm payrolls (NFPs) which was set up for a significant market response owing to the lofty, approximately 650,000 increase consensus forecast and the ADP’s 517,000 jump in private payrolls reported on Wednesday. Yet, we will see exactly how much market response can be mustered in thin conditions with this scenario. After the weekend, the range of scheduled event risks will be broad from high profile monetary policy updates like that from the Reserve Bank of Australia (RBA) to global sentiment surveys (eg IBD US economic optimism) to FX reserves amid fears over rising yields.
Chart of US NFPs, ‘Surprise’ Versus Expectations and ADP Private Payrolls (Monthly)
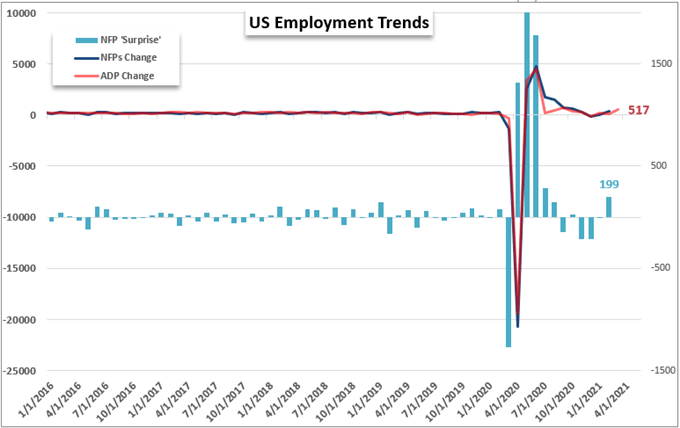
Chart Created by John Kicklighter with Data from the Bureau of Labor Statistics and ADP
Thematically, yield/rate forecasting and pandemic vaccinations curves both hold considerable potential to seize the reins; but given the docket and headlines, it would seem that growth presents the most promise to steer markets. This last week, the build up in the S&P 500 in its charge to and through 4,000 was anchored to US President Joe Biden’s announcement of the latest massive stimulus program. To give some perspective to the environment from which we are starting this infusion from, the ISM’s manufacturing activity report for March reflected a sharp rally to the highest reading since 1983. The US is principally a service based economy, however, so Monday’s ISM update for that sector will be important if liquidity restricted for market impact.
Chart of S&P 500 Overlaid with Manufacturing and Services PMI (Monthly)
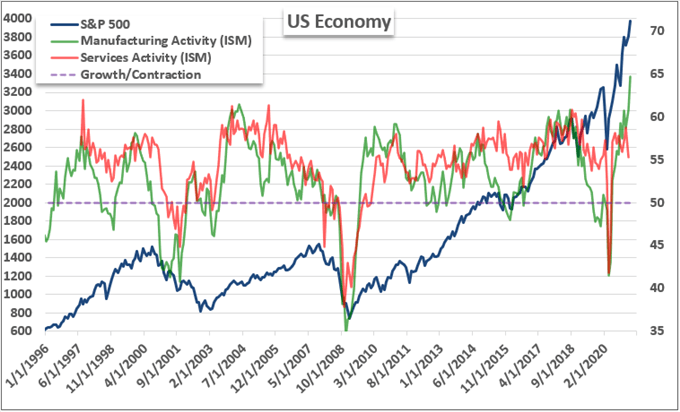
Chart Created by John Kicklighter with Data from the ISM
For global relevancy though, the IMF’s updated growth forecasts via its World Economic Outlook (WEO) scheduled for Tuesday release could really stir the expectations of recovery alongside the building appetite for higher return. While the implications for universal ‘risk on’ and ‘risk off’ perspective are clear, it is important to evaluate the relative appeal for the different economies’/regions’ assets to develop critical but thus-far measured moves from the likes of EURUSD and USDCNH.
Table of IMF GDP Forecasts for Major Advanced Economies and Emerging Economies
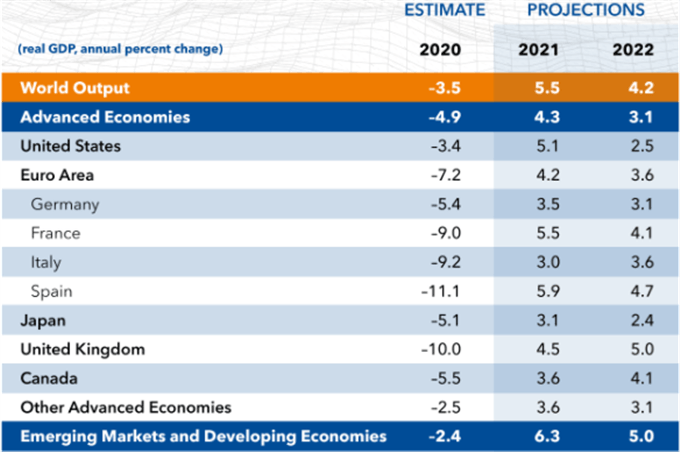
Chart from IMF World Economic Outlook January 2021 Update

.


