


S&P 500, Nasdaq, Credit Suisse and USDJPY Talking Points:
- US President Joe Biden confirmed the earlier leaked details of a proposed infrastructure spending program that would scale over $2 trillion
- The growth implications following the fiscal stimulus competes with expected corporate taxes to fund the initiative for market sentiment alongside lurking inflation fears
- Liquidity is now my top concern with holiday trading conditions ahead and markets like the S&P 500 and USDJPY stretched at highs

In the wake of US President Joe Biden’s detailed plan for an infrastructure spending program in the United States, markets were looking decidedly shaky on what the newest stimulus would mean for capital markets and risk trends. Most remarkable in my run through the benchmarks I review on a regular basis is the S&P 500’s reluctance to stretch to 4,000. While lingering at record highs, the additional stretch to the very prominent technical level seems to be actively rejected by market participants – including with an intraday reversal this past session that leaves a sizable upper wick. The draw of prominent psychological levels like these is their ability to top headlines outside of distinctly financial publications and the dense nesting of orders (entry, exit, derivatives) that are often found in the vicinity.

Chart of S&P 500 with 100-Day Moving Average (Daily)
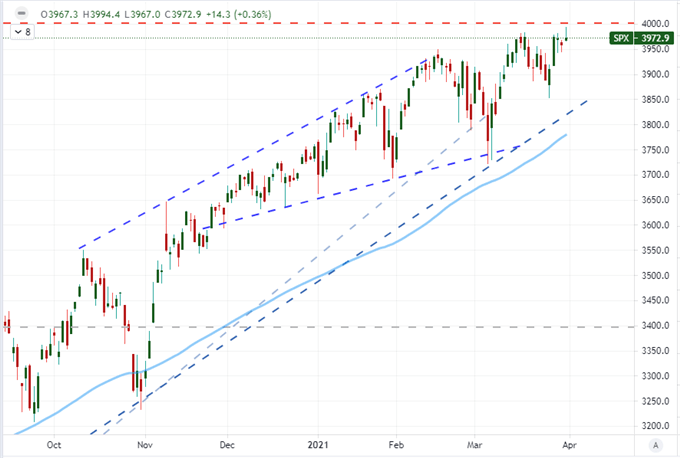
Chart Created on Tradingview Platform
Not all measures of sentiment are struggling like the US indices. Junk bonds for example are climbing as are 10-year government bond yields. Most impressive remains the Yen crosses. Where the only the USDJPY was really mounting a serious move through the start of the week, more of the major pairs followed suit with a smart daily rally for most crosses, three-year high for GBPJPY and two-and-a-half year high for CADJPY. Yet, USDJPY’s performance still tops them all for tempo and technical implication. The six-day rally the pair established through Wednesday is among the most robust moves for the pair back to October 2016. Having clear 109.50 and 110, upper bounds on prominent congestion patterns stretching back to 2013 would suggest an unencumbered charge. That doesn’t align, however, to expected market conditions. With other risk assets struggling and liquidity set to drain through week’s end, the motivation for this charge would need to come from the Dollar or expectation for higher yields (carry trade). That is possible but difficult to muster. Don’t expect an unchecked climb to be easy to muster through the end of this week.

Chart of USDJPY with 100 and 200-Day Moving Averages (Daily)
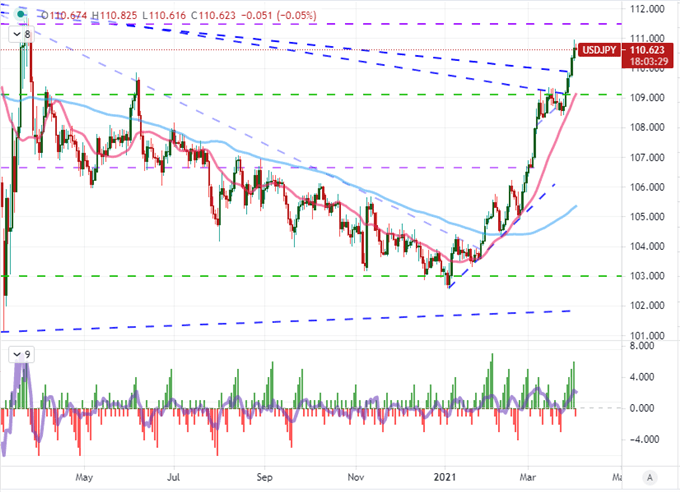
Chart Created on Tradingview Platform
With the most potent fundamental spark for bullish interests come and gone, it looks as it may be difficult to fuel confidence and bullish appetite through the waning hours of liquidity this week. Growth has been a quiet theme of support with Chinese PMIs Wednesday morning coming in better than expected alongside Canada’s 0.7 percent January GDP update. Perhaps the US ISM manufacturing report today can carry that forward a little further, but it doesn’t necessarily pack a punch under normal conditions. Meanwhile, the pressure of fundamental risk are building. France’s President announced a new four-week lockdown in his country owing to a resurgence of Covid cases, drawing concern that the rapid reopening from pandemic is uneven at best. I also remain concerned over the lack of enthusiasm to seize opportunity where the market is presumably most willing to reach – in speculative interest. The high profile tickers forced sold from hedge fund Archegos’s book (Viacom and Discovery in particular) have not recovered from their sharp slump. Further, two banks that seem to have absorbed losses related to the loans extended to the firm, Credit Suisse and Nomura, are also struggling.
Chart of Credit Suisse and Nomura (Daily)
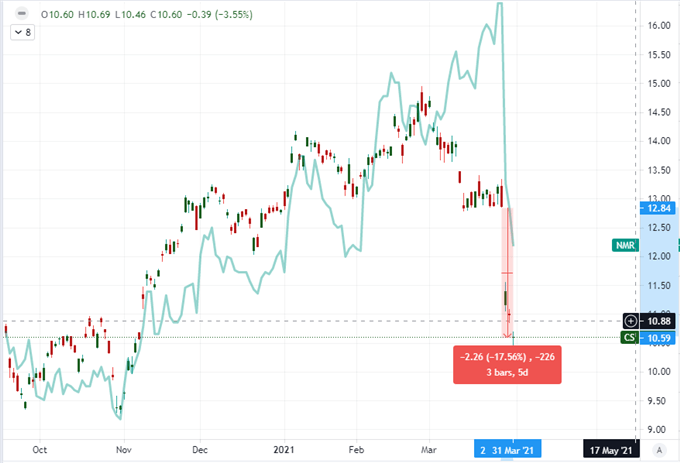
Chart Created on Tradingview Platform
Through these final 48 hours of trade this week, I believe that liquidity will be the most important feature of the landscape. That is not to mean that technical levels (like the 4,000 mark on S&P 500) or fundamental event risk (like NFPs on Friday) won’t matter. Rather, the shape of the response to these motivations will distort because there will not be the same depth of market to back the moves. Holiday trade on Friday will prove a severe drain on the ability to foster follow through on new breakouts and maintaining trends will struggle. In general though, the month of April typically sees a drop in volatility and less volume. The highest average performance for the SPX as a benchmark for risk will not be as easy to foster as we are not working off any material discount from which we can take advantage.
Chart of Seasonal Performance of S&P 500 with Volume and VIX
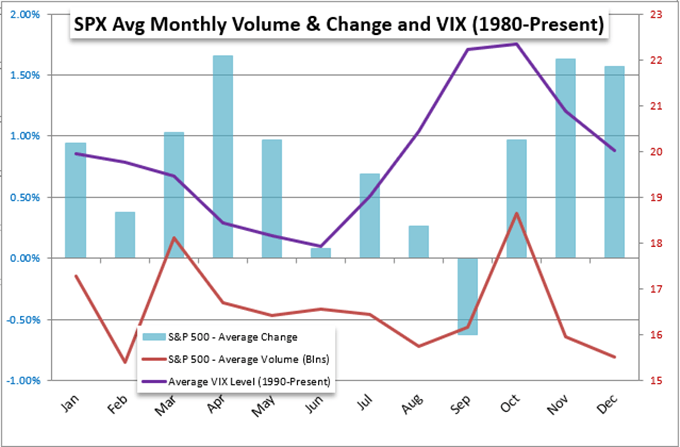
Chart Created by John Kicklighter with Data from Bloomberg Terminal
A last look at the top event risk to close out this week. While today’s calendar has a run of data that can offer context to growth and baseline economics, the nonfarm payrolls (NFPs) are still due on Friday. They are really the only meaningful data point scheduled for that day. Most of the markets will be running skeleton crews for the release, but it will still raise concern about holding high risk positions through the release. With an approximate 650K estimate increase for March by economists reinforced by the ADP’s 517K print this past session, the potential for a significant deviation is high.
Chart of US NFPs, ‘Surprise’ Versus Expectations and ADP Private Payrolls (Monthly)
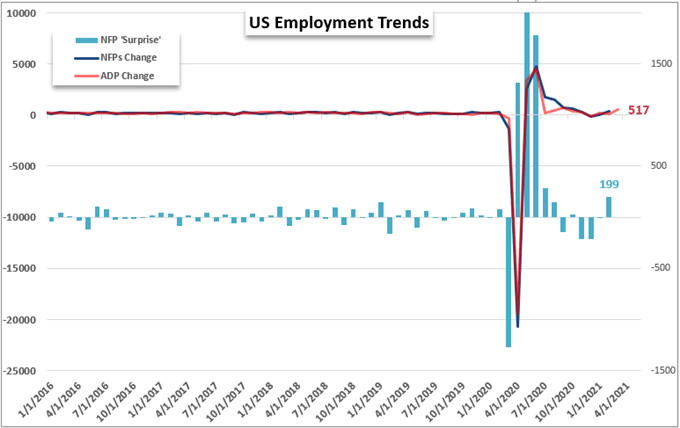
Chart Created by John Kicklighter with Data from the Bureau of Labor Statistics and ADP

.


