GameStop, S&P 500, Earnings and USDJPY Talking Points:
- Risk trends extended the intraday bullish reversal Tuesday via the S&P 500 and Nasdaq 100, but the speculative fervor seemed to spread further
- Yen crosses joined a broad mix of speculative appetite as did Reddit favorite GameStop which charged 100 percent higher during open hours and nearly 100 percent afterhours
- Powell’s testimony didn’t seem to play a serious role as a rise in 10-year yields continued but ahead US earnings may play a key role


Risk Appetite Rises So Acutely That Even GameStop Catches a Spark
After two weeks of consolidation, it seems that speculative appetite is once again catching serious traction. I prefer to draw my evaluation of sentiment from a wide array of high profile but otherwise unrelated risk-sensitive assets, and the general bearing was a bullish one with varying levels of intensity. For my preferred, imperfect measure of speculative intent – US indices – there was an extension of the rebound forged intraday on Tuesday. The S&P 500 and Nasdaq 100 were two of the most prominent benefactors in the continued upswing with the former offering a more steady 3.2 percent extension from its intraday low the day before while the latter was leveraging its sheer volatility for a 4.4 percent recovery from its own Tuesday low. There is still serious ground to cover before these measures return to record highs and such a performance isolated to this category of risk benchmarks is not going to go far to secure a prevailing trend. Nevertheless, this segment’s ability to lead the financial system going back the past decade should not be underestimated.
Chart of S&P 500 with 50-Day Mov Avg (Daily)
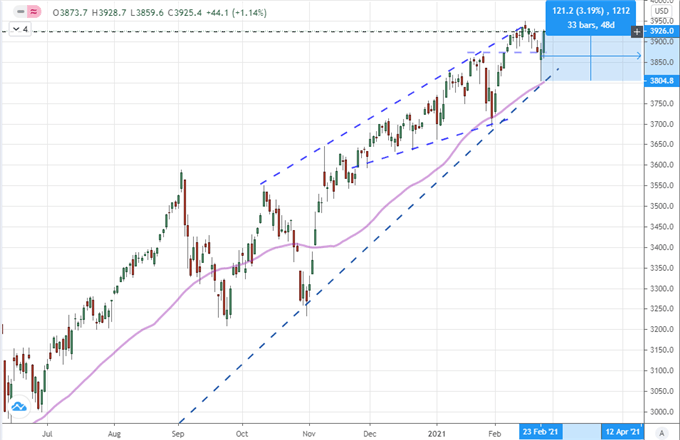
Chart Created on Tradingview Platform
Ultimate, I look for undercurrents as the effort to establish trends means more to me than ‘flash in the pan’ volatility. Nevertheless, traders should remain vigilant when it comes to the shape and proclivities of speculative reach across the financial system. A remarkable resurgence today – this past New York session and through after-hours trade – was registered against a very familiar name for those keep score: GameStop. It just so happens that a number WallStreetBets (the Reddit board that was behind the epic short squeeze in January) stocks were putting in for a bounce this past session, but GME managed an incredible approximate 100 percent jump this past session. Further, after hours, the market further pushed the stock close to a similar percentage climb. There is fundamental speculation circulating around that an Amazon exec may come on board to replace the GameStop CFO who recently quit, but I find that a justification-after-the-fact. There seems an appetite to capitalize on the quiet. That said, there isn’t anywhere close to the net short interest in January that fueled the climb; so make sure to evaluate bearing and momentum separately.
Chart of GameStop with 50-Day Moving Average (Daily)
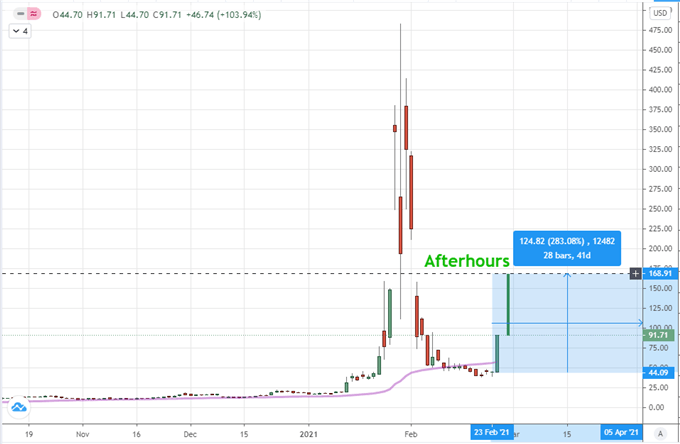
Chart Created on Tradingview Platform
While the S&P 500 has put in for a two-day recovery and GameStop has charged the fantasies of speculative appetites, my own assessment of trend potential to the upside is couched in far more skepticism and mechanical evaluation. For a true ‘risk on’ course, I’m looking for a combination of strong correlation in speculative assets with otherwise limited connection alongside tangible pacing. There was indeed a varying pace of ‘risk on’ across board, but the conviction was notably absent for the likes of global indices and junk bonds. Notably, one of the few remarkable areas of intensity to pop up this past session was in the Yen crosses. Carry trade has had a poor track record recently of following the ebb and flow of risk trends; but these crosses were forging multi-year highs as market participants weighed the possibility of higher yields in the foreseeable future.
Risk On / Risk Off Spectrum
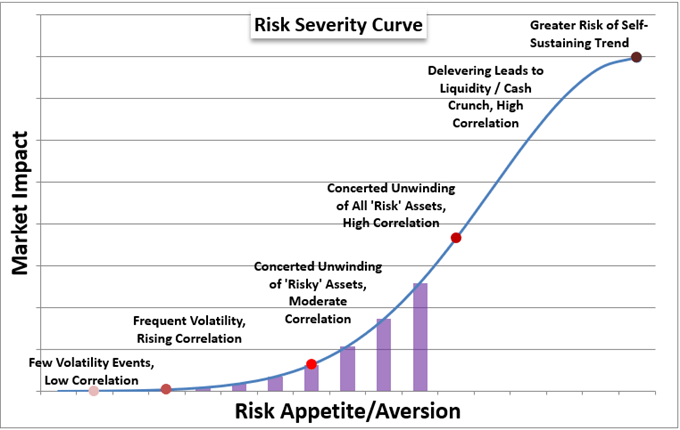
Chart Made by John Kicklighter
The Speculative and Fundamental Themes
Ultimately, there are catalysts and there are means when it comes to market motivation. Whether data, speech or breaking news item; much of what we consider fundamentally is the means. Ultimately, what can move the system and keep it going is the contrasting ‘means’ – the universal urge to drive a self-sustaining influx or outflow of capital. Despite the breadth of the rebound and a few areas of intensity, this still registers as a mere bounce with limited intent. That would seem to align to the record level of search interest in ‘buy the dip’ I mentioned yesterday…as well as the far greater search interest in ‘market bubble’. I will hold a perspective of skepticism in this rally until and unless there is something that truly reinforces a ‘risk on’ view across the system.
Read about how the rise retail can be a signal for a market mania.
Chart of Global Google Search for ‘Market Bubble’ and ‘Buy the Dip’ (Weekly)
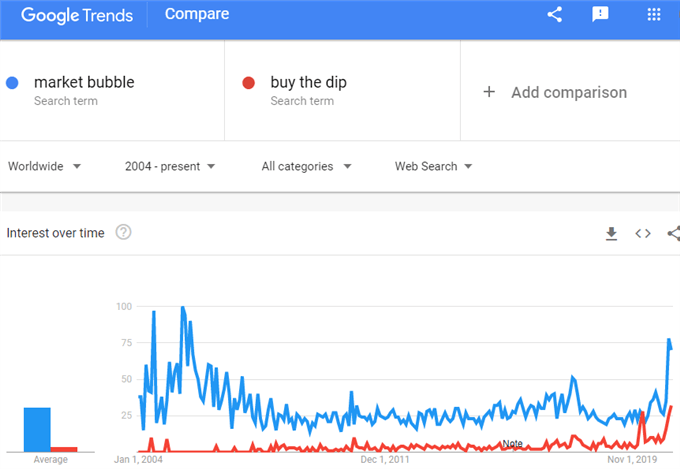
Chart Created by John Kicklighter with Data from Google Trends
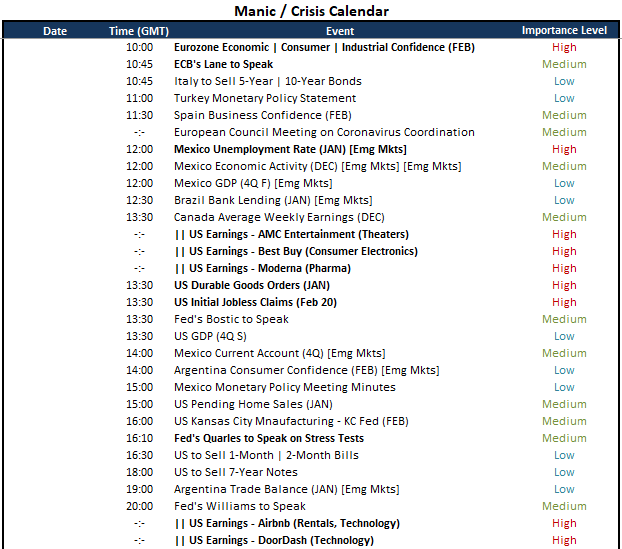
If you are looking for fundamental sparks to offer market encouragement, there is no better place than the docket. That’s not to say a headline referencing a Reddit darling or crypto asset put on alert with another Elon Musk tweet couldn’t translate into a ‘tail wagging the dog’. However, it is worth spending more time adapting to the possibilities of a known event risk. In the economic calendar over the next 24 hours, there are a few themes that will draw attention. That said, most traders will be looking to the session’s earnings. That is not due to the sheer market weight of these stocks on tap, but rather what they mean to the broader economy. Best Buy is a consumer electronics group that may benefit from the stay-at-home purchases that have been funded by the Fed. Moderna (MRNA) is due to report its earnings after its vaccine when live. AMC is on the opposite end of the Covid spectrum with the company trying to shake off its extreme volatility. The updates I’m really watching though are the after-the-close updates from IPO darlings Airbnb and Door Dash.
Global Macro Economic Calendar
Calendar Made by John Kicklighter
Through not bejeweled by meme stocks, a theme that I believe deserves a closer eye moving forward amid discussions of risk trends is the state of monetary policy. The major, Western central banks have committed to keeping their extraordinary stimulus either steady or rising. Fed Chair Powell reiterate that message at his second day of testimony before Congress (the House this time), but it wasn’t just US 10-Year Treasury yields rising today. The aggregate of US, UK, Eurozone, Japan and Australian market rates was the highest I saw In approximately a year. Let’s see if there is further weight to this theme.
Chart of US 10-Year Treasury Yield Overlaid with Aggregate 10-Year Yield (Monthly)
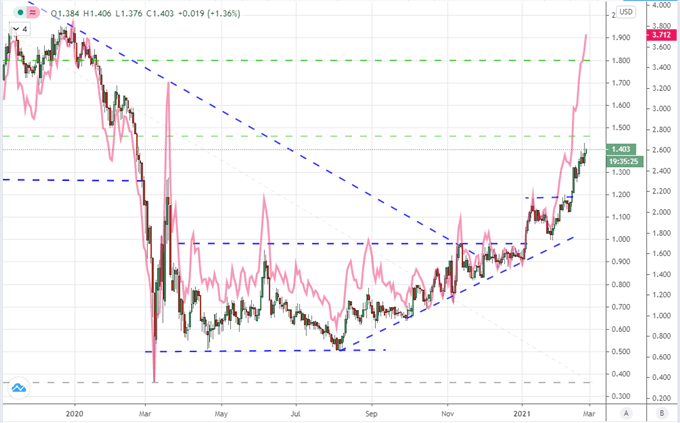
Chart Created on Tradingview Platform
The Outliers Again Find Volatility a Beneficial Environment
With the S&P 500 mounting a strong recovery and the other assets seemingly tracking higher, it is tempting to extrapolate what potential exists for all assets with a risk connection up and down the curve. My answer to that: circumstances play a key role. Consider the rise in Yen crosses this past session when paired with the unexpected rally from the Kiwi Dollar. News that the RBNZ’s mandate on monetary policy – though including a firm stance of accommodation – could effect sentiment.
Chart of NZDJPY with 1-Day Rate of Change (Daily)
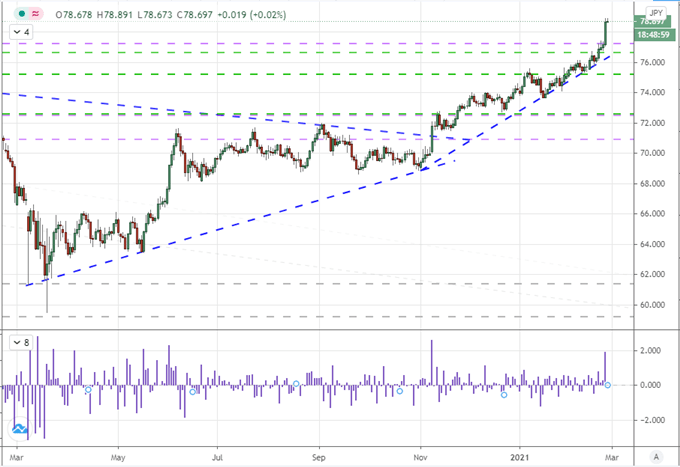
Chart Created on Tradingview Platform
While I am keeping a close eye on risk-led content via different venues, I think its is worth taking a moment to recognize those measures that don’t’ have a host of derivatives that also tend to eat up headline space. Now, that doesn’t mean we aren’t going to see volatility as the markets attempt to sort out their convictions. In the meantime, the EURCHF is working on an eighth-day’s gain. While the SNB is likely working to amplify a so-called reflation development, this wouldn’t be sustainable without some measure of risk trends.
Chart of EURCHF with 200-Day Moving Average (Daily)
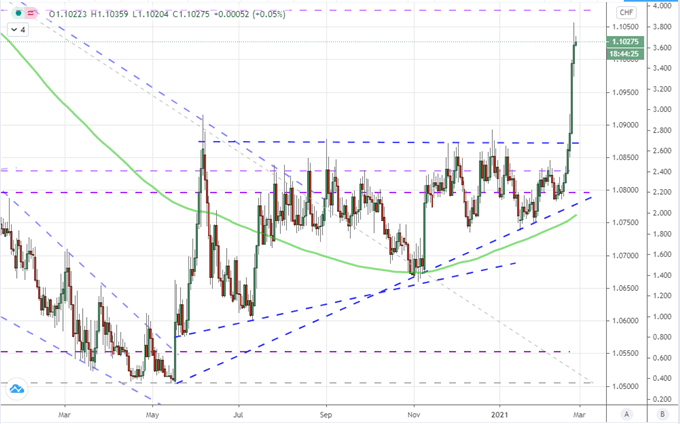
Chart Created on Tradingview Platform


.


