


S&P 500, Nasdaq, Treasury Yields, EURUSD and Bitcoin Talking Points:
- The S&P 500 and Nasdaq 100 dove Tuesday morning, threatening the post-pandemic recovery; but a sharp rebound into the close has forestalled a clean breakdown
- A strong intraday reversal from the speculative leaders of the past decade can be tagged to Powell testimony, but I suspect it is more owing to the BTD mentality
- Despite the Fed chair on tap, the Dollar held back from a technical break while Bitcoin rebuffed Elon’s confidence and the Laser Eyes meme

Risk Trends Put in a Floor Before Sentiment Truly Collapses
We seemed to be on the brink of a meaningful technical reversal this past session – at least according to the benchmark US indices – this past session until an afternoon charge in the New York afternoon saved market participants from having to make a significant decision on their preference for a complacent default. Perhaps roused by a genuine fundamental swell like Fed Chairman Powell’s testimony on monetary policy before the senate or merely roused by the familiar call to ‘buy the dip’, the baseline for speculative bearing over the past decade managed to put in a remarkable technical turn before the charts left a painful impression. While the Nasdaq 100 was perhaps the most dramatic picture of the day with a recovery from an approximately -3.5 percent loss on the day at its nadir – with a close that still slips the bottom of channel – the S&P 500 made the bigger statement. One of my favorite, imperfect measures of ‘risk’; the index reversed off its low leaving a sizable daily tail that bounced off its 50-day moving average and the trend channel floor that stretches back to the reversal from the pandemic low. It is a picture that few technical traders are likely to miss.
Chart of S&P 500 with 50-Day Mov Avg and Size of ‘Wicks’ (Daily)
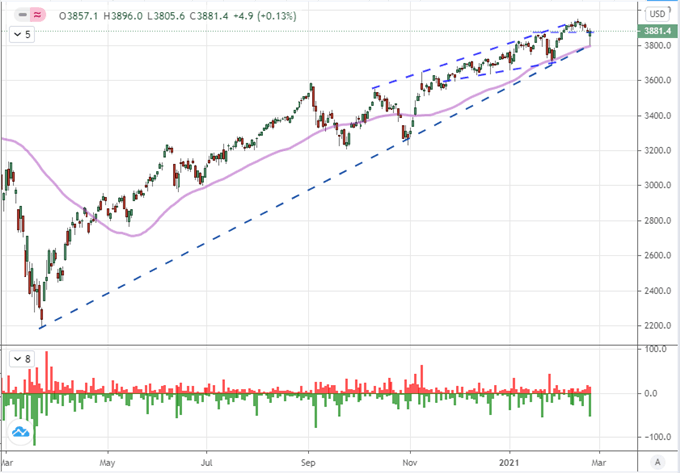
Chart Created on Tradingview Platform
As dramatic as the turn may have been from the US equity market, I would contend that other areas of ‘risk’ across the global financial system were not conspiring to insinuate the same drama in the system. Global indices from the Germany DAX to UK FTSE 100 to Japanese Nikkei 225 were not threatening to tip over the same cliff. Further, emerging markets, junk bonds and carry had eased but they didn’t express the same risk of true reversal in course. Commodities with a growth bent meanwhile wouldn’t even hold up the façade. I point this out because a true and absolute reversal in sentiment is often better served by a universal alignment of these otherwise unrelated measures.
Chart of Nasdaq 100 to Dow 30 Ratio Overlaid with Dow and 1-Day Rate of Change (Daily)
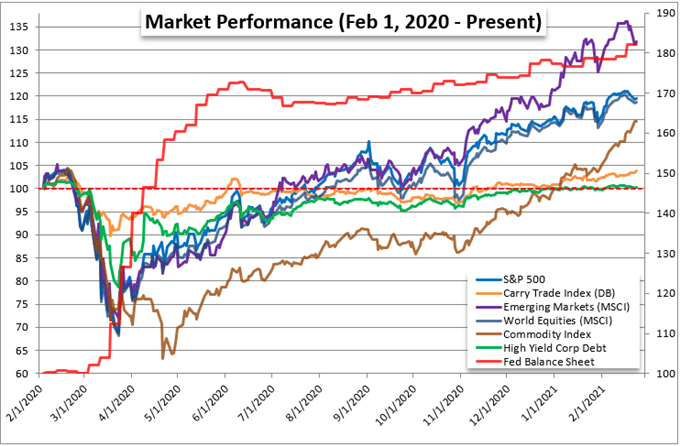
Chart Created by John Kicklighter with Data from Bloomberg
The Diamond Hands Crowd Met the Traditional ‘Buy the Dip’ Crew
As the focal point for risk trends has shifted away from the more familiar benchmarks for sentiment these past months, a new breed of jargon has arisen to match the time. For those active in the reddit boards, the term ‘diamond hands’ has been used to urge inexperienced or simply committed traders to hold through unfavorable tides until the market moves back in their favor. Experienced traders recognize that as casting aside a strategy with a planned stop to fall back on hope. That isn’t particular new or unique. Nevertheless, some of those that took this risky course on measures like the SPY ETF (number 5 on the top mentions for WallStreetBets this past session) felt vindicated with such a move. Yet, for the actual lift, it looked like an older hand among the risk spectrum was making an impression: ‘buy the dip’. The call for those truly committed to the bullish eventuality of markets and willing to trade against corrections these past months and years – also referenced as BTD or BTFD – surged as the threat hit its peak. The move has been fulfilled with the bounce. Will it posses the staying power between the two ‘generations’?
Read about how the rise retail can be a signal for a market mania.
Chart of Global Google Search for ‘Market Bubble’ and ‘Buy the Dip’ (Weekly)
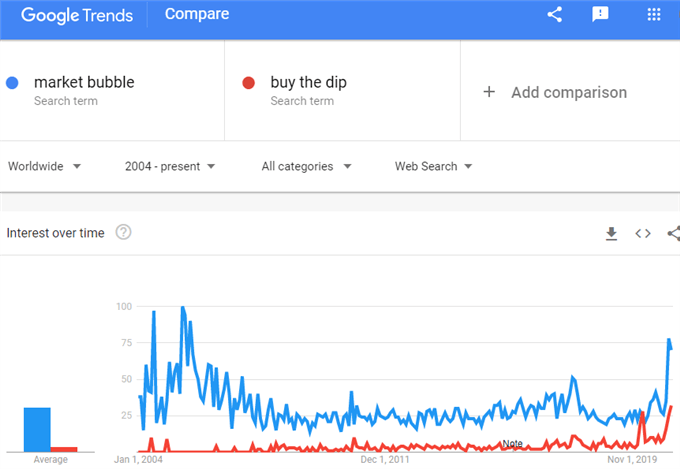
Chart Created by John Kicklighter with Data from Google Trends
The Fundamental Justification
For those that refuse to be swayed by a sentiment-derived trend at such a critical technical point, there were a few fundamental events that could be used to justify the relief rally in capital markets. The Conference Board’s US consumer sentiment survey edged up to 91.3 which can buoy expectations for consumption for the world’s largest collective source of growth. Then again, the edge up is modest and doesn’t materially alter the global outlook. In contrast, Fed Chairman Jerome Powell’s testimony before the Senate offered the expected reassurances that the tap for stimulus would not be closing any time soon. Interpretation of this news could have played out either way, but the market chose to register it as a boost to confidence. It’s possible Powell’s second day answering questions – this time before the House of Representatives – could elicit a different response, but it would likely take a remark far off the script to truly rouse a market turn.
Chart of US 5-Year Breakeven Inflation Rate and 10-Year Treasury Yield (Monthly)
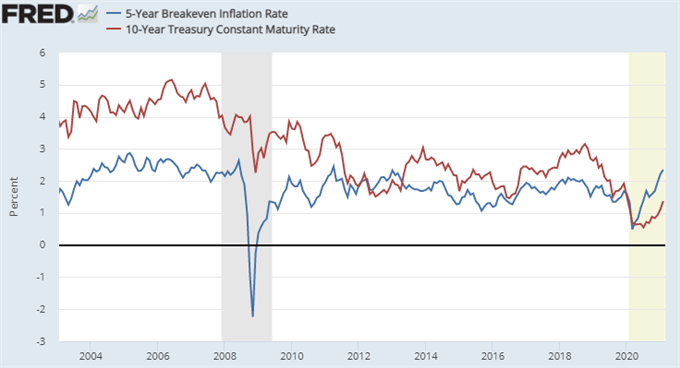
Chart Created on St Louis Federal Economic Database
While Powell’s second day talking to Washington politicians presents the most extreme scenario of altering the view on risk assets, its more likely to land for US Treasury Yields and the Dollar. The 10-year yield hovered around 1.35 this past session but the second break from climb in 8 trading days was nevertheless being discussed. The Greenback in the meantime was not drawing much from either the preceding move or the more recent indecision. Recent history could have led us to expect higher yields to lift the Dollar, but that hasn’t been the case recently. With pairs like EURUSD on the cusp of short-term congestion borders (like 1.2175 to the top side), I’ll be looking for any signs of recognition.
| Change in | Longs | Shorts | OI |
| Daily | -1% | -4% | -3% |
| Weekly | 4% | -10% | -5% |
Chart of EURUSD with 50-Day Moving Average (Daily)
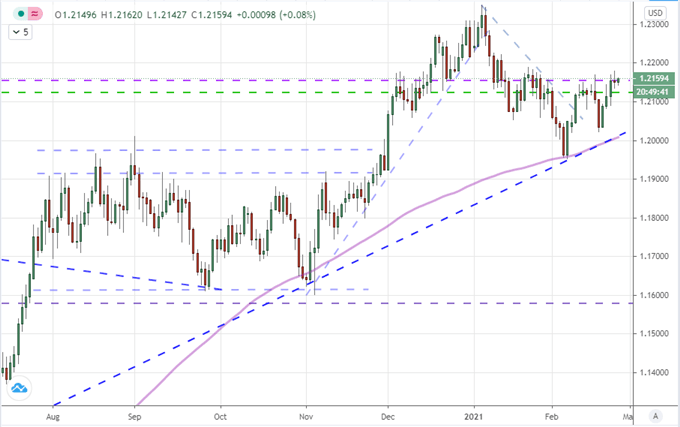
Chart Created on Tradingview Platform
Stand Outs Among the Reticent Trends
While indecision has prevailed among many of the benchmarks in the speculative rank, there have been a few remarkable stands outs with more recent stirrings. I mentioned copper yesterday which pushed a new intraday and close high stretching back to August 2011, there was a more recent reversal seemingly threatening to catch traction this past session in Bitcoin. In a second day of remarkable volatility, BTCUSD ultimately notched a second large decline. This would secure the biggest two-day drop from this recent speculative favorite since March 13th – the height of the pandemic selloff. There will naturally be speculation/fear that this could be a tumultuous top going in, but a roughly 15 percent correction on a nearly 500 percent climb over the past 6 months would should not be lightly concluded.
Chart of Bitcoin’s BTCUSD with 200-Day Moving Average and 2-Day Rate of Change (Daily)
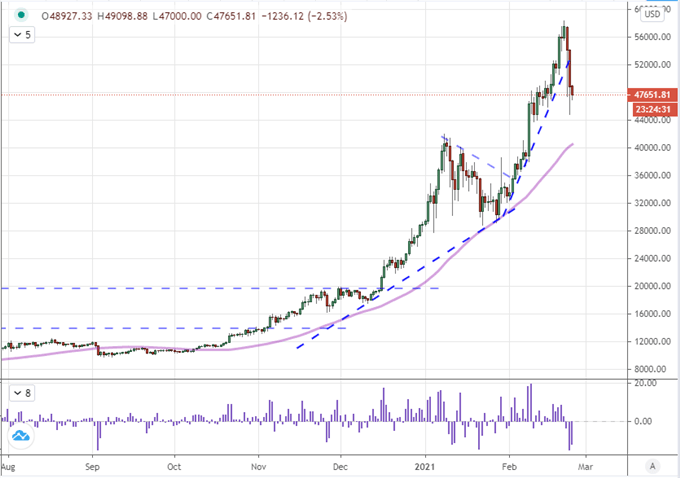
Chart Created on Tradingview Platform
A more unusual trend to arise just through this week that should draw attention is the suddenly intense slide from the Swiss Franc. EURCHF is prone to bouts of intense volatility in between long stretches of inactivity. The pair registered its biggest single-day rally since August 2017 Tuesday on a technical break that dramatically cleared 1.8075 resistance capping bullish intentions through the past year. This looks like a clear break, but follow through is not a familiar feature for this pair – even when external forces like the SNB are attempting to urge the move effort forward.
Chart of EURCHF with 200-Day Moving Average and 1-Day Rate of Change (Daily)
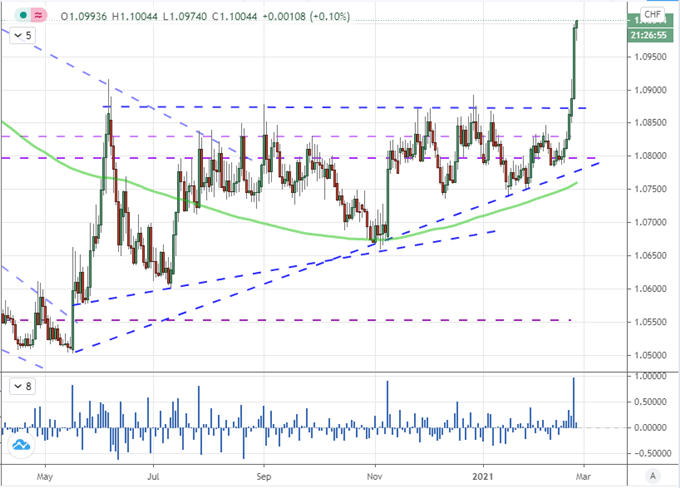
Chart Created on Tradingview Platform

.


