S&P 500, VIX, EURUSD and Dollar Talking Points:
- Risk aversion seems to have kicked in through week end with the S&P 500 breaking tight congestion despite President-elect Biden’s stimulus plan
- The Dollar broke higher – EURUSD sliding below 1.2150 – but it is not clear whether it was due to its relative growth or safe haven appeal
- Top event risk looking ahead to next week includes: China 4Q GDP; the Presidential inauguration; ECB and BOJ rate decisions; earnings and January PMIs


A Tentative Technical Break That Immediately Hit Illiquidity
After a week of remarkably-tight consolidation – at record highs – the S&P 500 and other US Indices were due for relief. Between President-elect Biden’s massive $1.9 trillion stimulus plan announcement and Fed Chair Powell’s assurances that expansive stimulus would remain in place through the foreseeable future, the natural expectation would be for a bullish break, if anything. Yet, that wasn’t the case through Friday trade. A drop through 3,775 support may have roused more bearish concern than what we have seen thus far in 2021, but it was far from a reliable signal of a full scale breakdown. This pressure relief move registers as the ‘path of least resistance’ and now the evaluation of commitment for the week ahead and beyond comes into play. The technical cue weighs less on my evaluation than the fact that the SPX and counterparts broke lower despite traditional measures of speculative support. Now, we head into a new week with a dense economic calendar that includes further political scrutiny punctuated with clear economic data.


Chart of S&P 500 with 5-Day Average True Range (Daily)
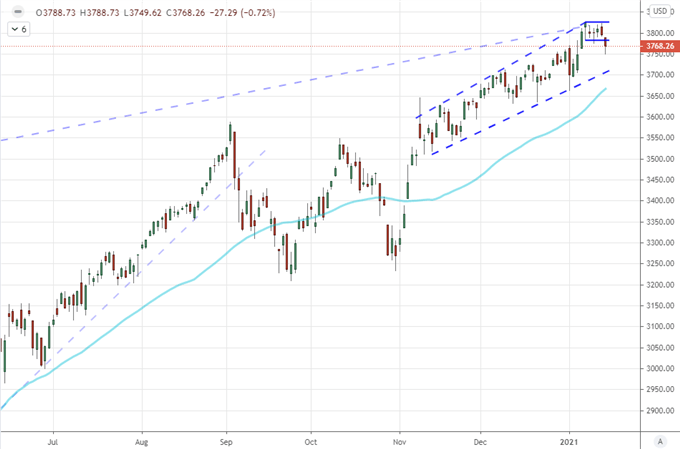
Chart Created on Tradingview Platform
What was most remarkable in the market’s progress through this past week was not that the speculatively-leaning benchmarks took a dive to close trade, but rather that they did not advance. Committing to a decisive bear trend after months of post-pandemic recovery that would override fears rooted in more traditional concerns necessitates a tangible line to follow. That may be in the cards moving forward, but it is not already in play from the themes and data we have already be dealt. On the other hand, we have seen the US equity market forge record highs on the basis of risk appetite that has cast aside issues that includes questionable growth forecasts and deflated rates of return. Part of that prevailing confidence is the external influence of risk appetite fed by stimulus expectations – both from central banks and governments. Well, the US government, which the Fed Chairman had passed the baton to in recent remarks and which has the deepest pockets, finally offered up plans of a massive support program and the market slipped. Is this a ‘buy the rumor, sell the news’ response? Mere obliviousness to the update would be just as dismissive to risk trends.
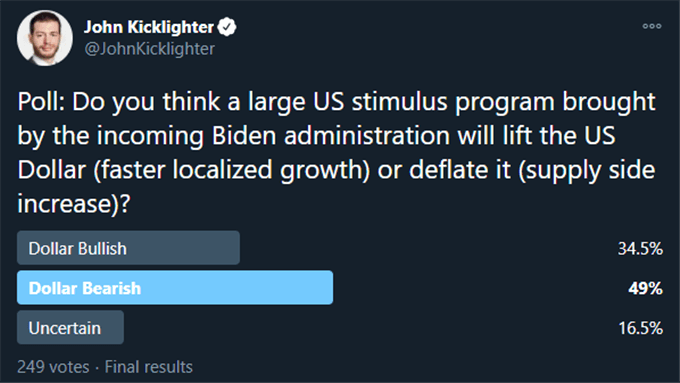
Twitter Poll for US Stimulus Program Supporting a Dollar Bullish or Bearish Outcome
Poll from Twitter.com, @JohnKicklighter
Risk Trends to Monitor Next Week
A slip in traditional risk measures through the close of this past week is not the same thing as triggering a full risk unwind to unfold into this week and beyond. And yet, it raises the risk of such an outcome. In particular, I am watching the VIX volatility index which has consolidated for months above the 20 handle. This market-favorite measure of ‘fear’ has held above this historical average for a remarkable 227 trading days. Furthermore, it has worked its way into a terminal wedge which would completely run out of room to maneuver in a few weeks times. While this measure has become a speculative tool in its own right – rather than a pure reading of statistical volatility – it doesn’t tend to ‘break’ lower. We have seen numerous instances of technical moves in a check higher on the other hand.
Chart of VIX Volatility Index (Weekly)
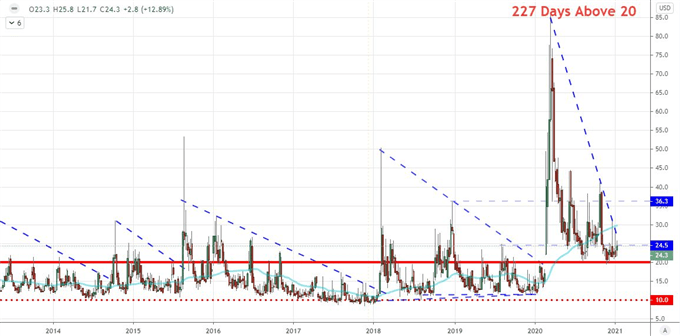
Chart Created on Tradingview Platform
Top Fundamental Sparks: GDP; Inauguration and Monetary Policy
While sentiment is the ultimate current to carry markets to a collective bull or bear trend, getting the ball rolling is often best served by significant fundamental event risk and themes. There is plenty to chew on in the week ahead. One key event that I will not underestimate this time around is the US inauguration which will transition the Presidency from Donald Trump to Joe Biden. I had expected the electoral college count to be a mere procedural event, but the storming of the capital threw that norm into disarray. A similar tragedy could befall this next traditional step. In more traditional terms, economic activity is a docket item this week. It starts on Monday morning with China’s 4Q GDP release. While important, market participants take this data with a bolder of salt. More market-derived would be the January PMIs for the developed world that are due Friday. Yet, that will translate in more anticipation than market impact through the week.
Chart of Economic Activity of Markit PMIs (Monthly)
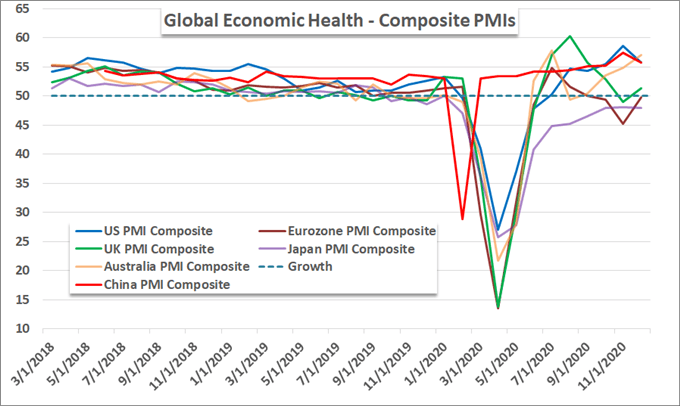
Chart Created by John Kicklighter with Data from Markit
Another themes to monitor for more than is influence on general speculative appetite is the impact of major central bank policy update. Over a run of 24 hours, a host of major central banks will announce their policy intend over Wednesday and Thursday. Of course, this will put the data’s influence in conflict with the inauguration as a top market moving theme. Yet, that doesn’t diminish the relative/localized market impact. While I will be watching the Bank of Canada (BOC), Norges Bank, South African Reserve Bank (SARB) and Brazilian Central Bank policy decisions; they don’t wouldn’t scale up to global market movers – even with a surprise shift. That said, the extremely accommodative European Central Bank (ECB) and Bank of Japan (BOJ) could influence market-wide sentiment even with a measured shift in expectations.
Chart of Major Central Banks’ Balance Sheets in Billions of Dollars (Monthly)
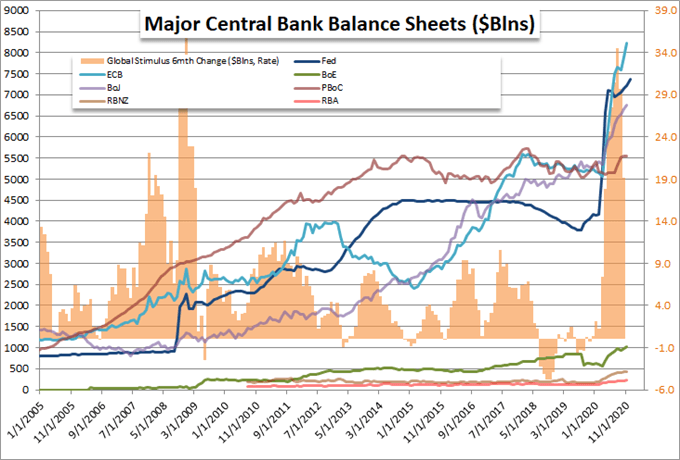
Chart Created by John Kicklighter, Data from Fed Database and Bloomberg Terminal
Key Pairs to Watch
While I will be watching high profile risk assets like the S&P 500 and VIX for important market bearing, the regional focus will draw me to the various currency crosses. That said, the Dollar majors are among the more interesting pairs in my view. Through EURUSD clear the critical technical floor of 1.2150 – the midpoint of its historical range – the committing to a full fledged reversal is a serious commitment. If we need to look at it in technical terms, the 50-day moving average and a subsequent recent-range 38.2 percent Fib stands immediately below at 1.2050. On a fundamental basis though, it is not clear if this provocative move is arising due to risk aversion or appetite for the relative growth appeal of the US compared to its global counterparts. What is driving this initial spark matters as a falter on either them could stall the move in its tracks.
Chart of EURUSD with 50-Day Moving Average (Daily)
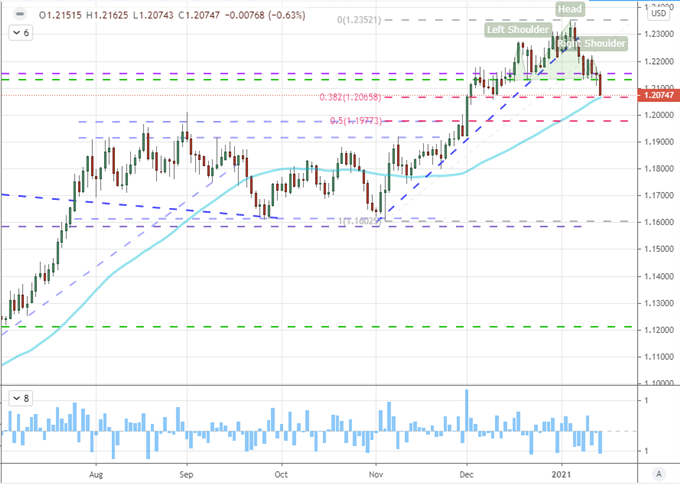
Chart Created on Tradingview Platform
In general, EURUSD is a loaded currency cross because of its sheer liquidity. In other words, it can be difficult to urge this pair into a definitive trend. If you are looking for a pair that is more risk-oriented, NZDUSD would be more interesting with a break below 0.7160 which clear trendline support and a 50 percent Fib (of the range from 2014 to present). Yet, this move would require conviction. Everything considered, I like GBPUSD’s traits more. The pair has pulled back from channel high and has technically cleared tight congestion support. Yet, the move would be more readily described as a subsequent range swing back down to 1.3200 which would be technically easier to achieve. There is much to watch for the week ahead.
| Change in | Longs | Shorts | OI |
| Daily | 3% | -7% | -3% |
| Weekly | 4% | -10% | -5% |
Chart of GBPUSD with 100-Day Moving Average and COT Net Spec Positioning (Weekly)
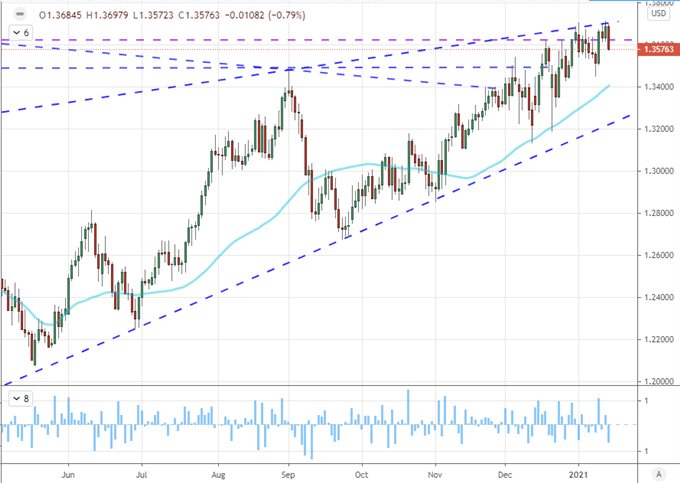
Chart Created on Tradingview Platform


.


