


Nasdaq, Tesla, Bitcoin and GBPUSD Talking Points:
- Friday may have closed out the market’s practical liquidity for the year, but speculative turbulence continues to churn
- Tesla’s inclusion into the S&P 500 will stir Monday S&P 500 volatility, Bitcoin is still pushing record highs and IPO news continues to fuel appetites
- US stimulus and Brexit talks are lingering uncertainties and sources of potential volatility in these final weeks of the year

Little Relief in Risk Trends as Liquidity Fades into Final Two Weeks of 2020
We have closed out the last full week for liquidity this trading year. While we still have two weeks of 2020 left, market liquidity through this period will be thin and choppy. With much the Western World closed this coming Friday for the Christmas Day market holiday and the following Friday an even broader shutdown for New Years Day, investors will be particularly cognizant of the gaps that could increase the risk to positions they intend to hold through the turbulence. We perhaps some of the recognition to the difficult ahead in Friday’s price action and volume for the likes of the S&P 500, Dow and Nasdaq 100 – though that could find just as much influence from the forthcoming Tesla inclusion. Between record highs, unfulfilled fundamental expectations and seasonal forces; unusual conditions should be considered high probability.
Chart of S&P 500 with 20 and 200-Day Moving Average as Well as Volume (Daily)
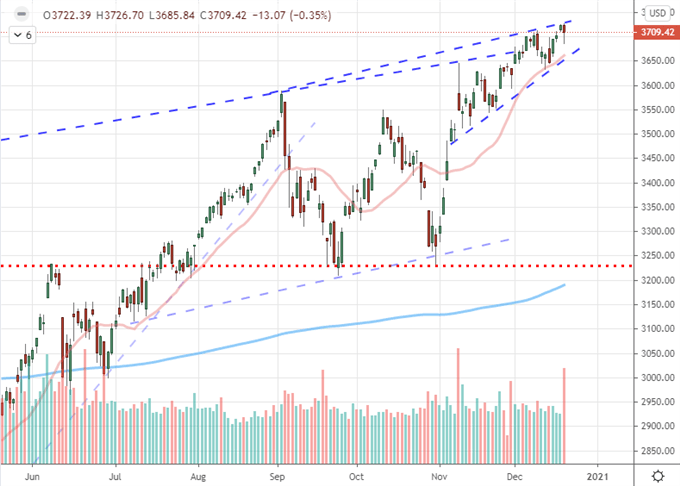
Chart Created on Tradingview Platform
We are currently wading into curious waters. There is little doubt that speculative appetite is firmly to the market’s back through the past eight months – and arguably through the past 10 years. That underlying enthusiasm may be ill-founded in traditional fundamentals, but there is no denying the course to record highs for the S&P 500. This looks very much like it is fulfilling the natural expectations through this final month of the year. I have referenced it frequently of late, but the seasonal breakdown for the aforementioned breakdown finds December averaging an impressive gain over the past 40 years amid expected slide in volume and volatility. With the final weeks leading market participants to evoke the comfort of the ‘Santa Claus rally’, the assumptions for reserve will be powerful. That said, the reward in committing to an already stretched market will not balance well relative to the risks should something go wrong.
Chart of S&P 500 and VIX Seasonal Performance by Month Back to 1980
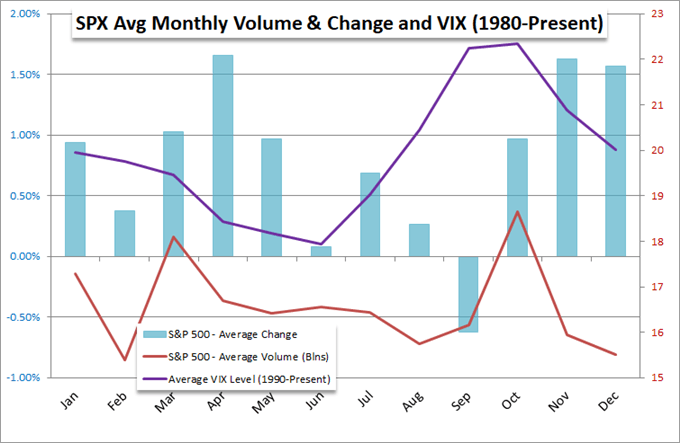
Chart Created by John Kicklighter with Data from Bloomberg Terminal
I am keeping close tabs on this not-so-modest risk even through these broken final weeks – perhaps with an even more wary eye for cracks. Looking at the different measures of extreme risk, there are figures that pose greater concern than merely a benchmark pushing an unprecedented high from which it could possibly fall. Of greater concern is data which shows a build up of financial and thematic leverage to ring more return out of these already tilled markets. Options interest in popular assets like the Nasdaq-based QQQ give some sense of the reach. More broadly, option trading has hit a record while retail (or at least small orders) have hit a record high representation for turnover. As the saying goes: leverage can amplify risks as readily as gains.
Chart of QQQ Nasdaq ETF with Put and Call Options Open Interest
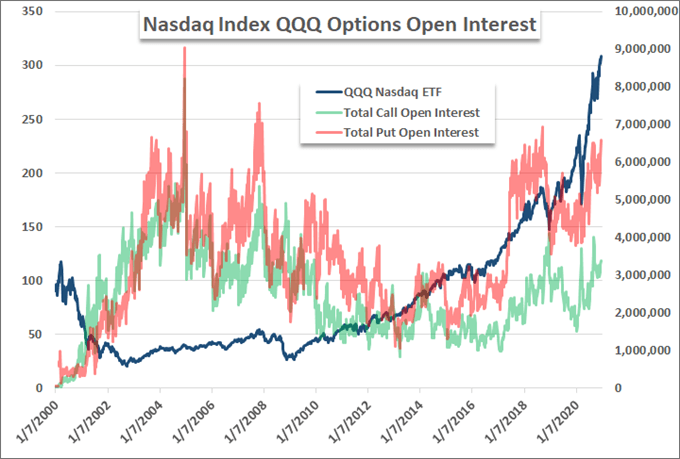
Chart Created by John Kicklighter with Data from Bloomberg Terminal
Top Volatility Speculative Benchmarks on My Radar: Tesla and Bitcoin
In the spirit of monitoring uncertain financial flows, I find particular value in keeping tabs on the most celebrated – or reviled – leaders on the board. At present, that is Tesla and Bitcoin for me. For the TSLA, the stocks indomitable run has overtaken the 700 percent growth milestone as of Friday. Though it didn’t really need much help for its trajectory, the impending inclusion for the stock into the S&P 500 index Monday seemed to further charge the company. But, what will that mean for the index on the week’s open and beyond.
For Bitcoin, the explosion above 20,000 drove the biggest weekly rally in 18 months. This is what technical traders usually suspect from breakouts – strong follow through – though the so many areas of the financial system fail to deliver given the stretched backdrop. The appetite for speculative build up is pushing out further and further into the fringes. From the liquid S&P 500 to Nasdaq option to erratic IPOs to purposefully market capped Bitcoin there seems a performance spectrum that seems to track a shift up the risk scale.

Chart of the Bitcoin with Volume Overlaid with Tesla (Daily)
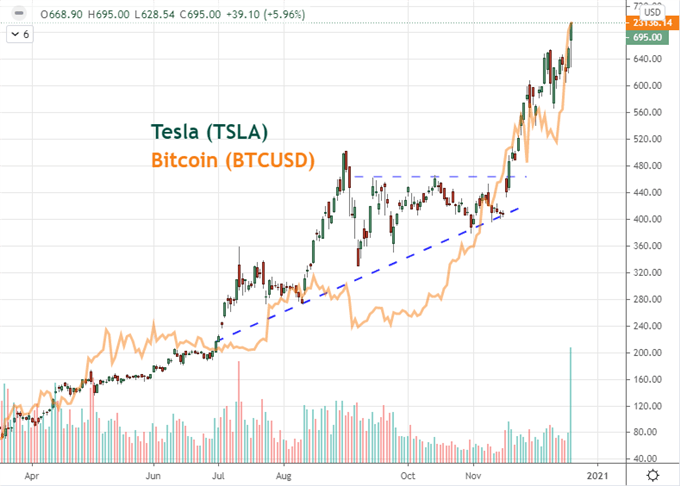
Chart Created on Tradingview Platform
US Stimulus and EU-UK Trade Talks Still Potential Volatility
Just because markets will thin out over the next two weeks with a few disruptive breaks due to holiday closures, doesn’t mean we couldn’t experience piercing volatility. In fact, low liquidity conditions tend to exacerbate the sudden and extreme price moves, though they do tend to trip up trends before they can truly take off. As such, I will keep track of the most unpredictable but high profile issues still playing out. The US stimulus talks are still unresolved heading into this weekend with a last minute gap funding keeping the government at the table for at least another few days. With the crushing recognition that millions are risk of losing their temporary unemployment benefits soon, a sudden update could be the source of a strong relief or panic move.
| Change in | Longs | Shorts | OI |
| Daily | -1% | -4% | -3% |
| Weekly | 4% | -10% | -5% |
Chart of the EURUSD with 20 and 200-Week Averages (Weekly)
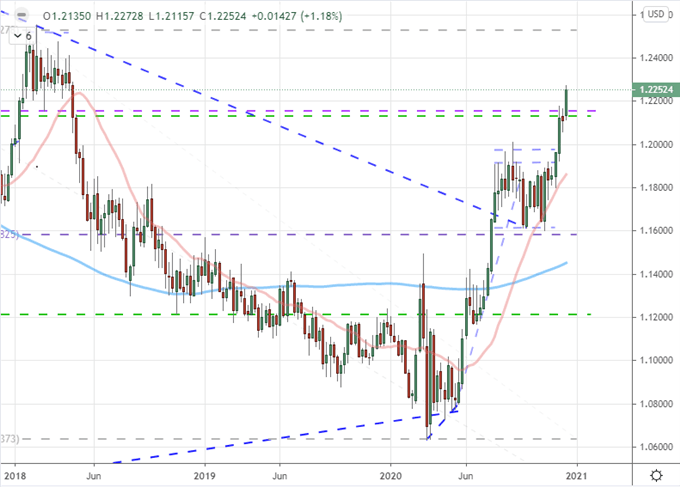
Chart Created on Tradingview Platform
Another fundamental countdown is the seemingly unending UK-EU trade talks. The United Kingdom voted for Brexit way back in June 23rd/24th, 2016. The separation is ongoing to this day. Yet, final split with a trade cut off seems finally at hand. According to the terms for this unprecedented move, without a deal immediately struck between the two sides, the two will resort to a baseline trade relationship at the start of the new year with a significant economic impact. While it is expected at this point, a further drag out of the timeline wouldn’t be an abrupt collapse in fundamentals; but tolerance may falter through this ‘buy the news’ run.
| Change in | Longs | Shorts | OI |
| Daily | 3% | -7% | -3% |
| Weekly | 4% | -10% | -5% |
Chart of the GBPUSD with 100 and 200-week Moving Average (Weekly)
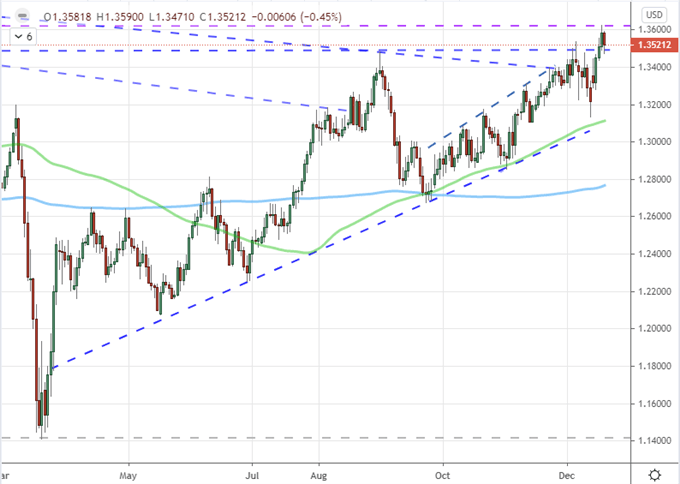
Chart Created on Tradingview Platform
In Conditions to Prioritize, GBPJPY Is the Type of Pair I Will Watch
With the conditions to consider for these final two weeks, my expectation is for tendency towards ranges and perhaps false breakouts punctuated by acute risks of volatility. With a limited traditional docket, the list could be long for congestion prone setups. Since volatility can be harnessed in proper conditions in swings between set bands, I will be monitoring GBPJPY closely. If the Brexit situation is a tall task to urge outright enthusiasm and risk trends are most likely to find urgency in risk aversion only, this Sterling-grounded carry currency pair harnessing a lot of fundamental powder.
Chart of GBPJPY with 50 and 200-day Moving Averages (Daily)
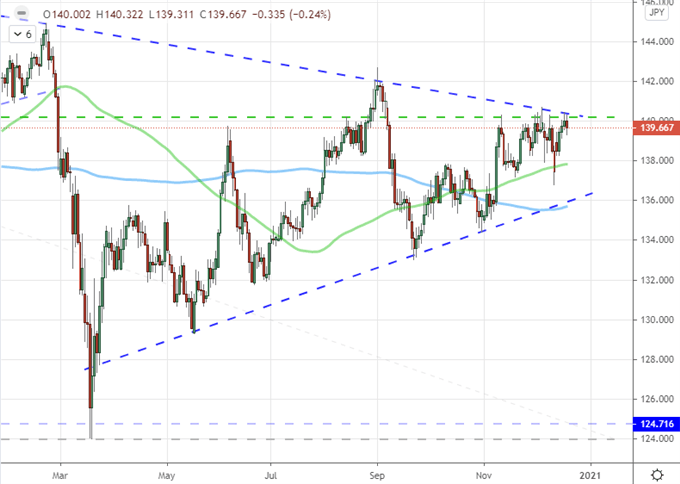
Chart Created on Tradingview Platform

.


