


S&P 500, Dollar, GBPUSD Talking Points:
- The US Presidential Election is heading into its fourth day without a clear winner, but markets are starting to skew their expectations…and bids
- Remarkably, an extended count hasn’t put off the S&P 500, but the Dollar has noticeably spun its tires recently – though it is not clear as a haven or growth candidate
- While the US election outcome is top concern for now, the monetary policy events yesterday (BOE and Fed) and Friday’s NFPs remind us that there are other matters to evaluate
The Priority for Short and Long-Term Bearing Remains the US Election
There are a number of fundamental issues that can eventually weigh in with significant volatility in the capital markets – or even development of systemic trends. The threat assessment radar ranges from the broad concerns of a resurgence of coronavirus cases and the government’s response to discreet event risk like Friday’s October NFPs release. There is a plenty that can fractionally alter the course of the underlying market, but the top potential in my book remains with the count on the US election. There are four states that were under close observation Thursday night – Pennsylvania, Nevada, Georgia and Arizona – which have kept the world on tenterhooks…if not the markets.
How could US elections impact the markets? Click here to see our aggregate report on the market reaction to election.
Chart of PredictIt Betting Markets Expectations of Election Outcome
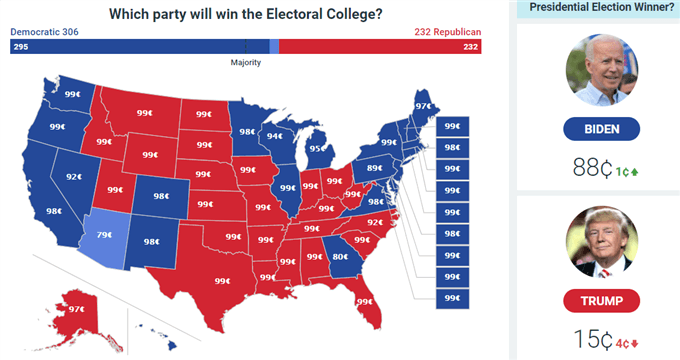
Chart from PredictIt.org
Despite the drawn out political situation in the United States, risk trends have not suffered for the uncertainty. From the S&P 500, the four-day rally thus far this week has represented the biggest bullish charge over such a period since the first thrusts higher in the recovery after the Pandemic collapse. Excluding that historical reference, we haven’t seen a burst of speculative enthusiasm since all the back in the early days of the recovery following the Great Financial Crisis – back in 2009. I remain dubious that this surge is the foundation of a developing trend rather than a relief rally. However, bulls may find enthusiasm in the recognition that this is not just a bid isolated to US indices. The risk appetite is showing in global indices, emerging market assets, carry and other measures of speculative intent. This still doesn’t sway my convictions of trend intent, but it raises the probability.
Chart of the S&P 500 with 100 and 200-Day Moving Averages with 4-Day Rate of Change (Daily)
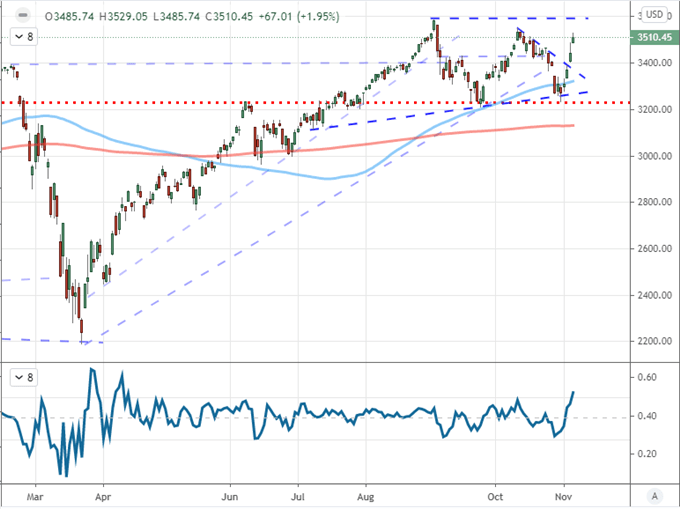
Chart Created on Tradingview Platform
One reason why the bid in the S&P 500 – as a representative of risk trends – is perhaps not particularly surprising is the results I have found in my recent poll. In response to expectations for the election outcome and market performance, the split between Trump and Biden is less interesting than the over 75 percent expectation in the results that the market would go up regardless of the victor. That said, we don’t yet have a clear outcome. Extended uncertainty may be finding an offset in the traditional ‘buy the rumor’ that is the result of a forward looking market. But does that mean there is a ‘sell the news’ in store ahead?
Twitter Poll On S&P 500 Response on Election Outcomes
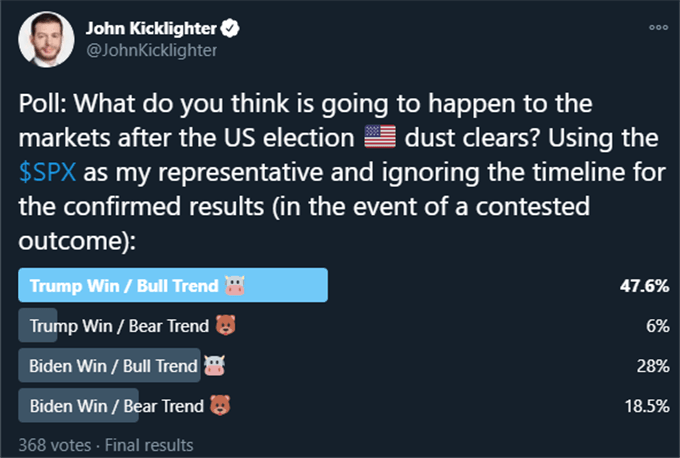
Poll from Twitter.com, @DailyFX
Interestingly, the short-term interest of retail traders has seen a violent swing in positioning with the overall impressive climb this week. Nearing a net long position to end this past week, we now find more than 70 percent of open interest via the IG CFD exposure is now net short. It seems that this crowd puts more stock in the sanctity of the range than they do in the potential of fundamental scenarios.
| Change in | Longs | Shorts | OI |
| Daily | 3% | -7% | -3% |
| Weekly | 4% | -10% | -5% |
Chart of S&P 500 and IG Retail CFD Positioning (8 Hour)
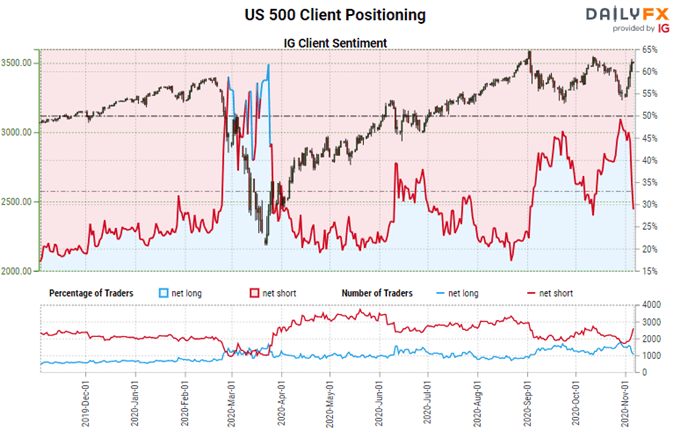
Chart from DailyFX
A Dollar’s Response that Doesn’t Add Up to Expectations
In contrast to the S&P 500’s enthusiastic charge, the Dollar hasn’t shown the same bid. In fact, the Greenback has struggled mightily this week. That is perhaps not very surprising given the uncertainty in the US fundamental backdrop, but it does call into question the notion of enthusiasm for indices on the basis of an anticipated forecast for the election results. The DailyFX Dollar poll offered a similar bullish lean for the Greenback regardless of the Presidential candidate the tally supported. The DXY Dollar index is not far from multi-year lows and not clear on its intent.
Chart of DXY Dollar Index with 100-Day Moving Average and Daily Wicks (Daily)
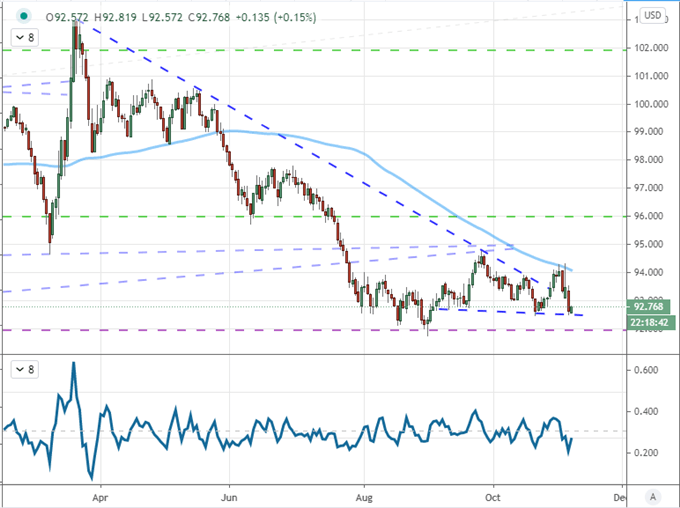
Chart Created on Tradingview Platform
While EURUSD and USDJPY were remarkable pairs to track this past session, the most impressive pairing among the majors was GBPUSD this past session. That is not to say it offered up any critical trends to speak of, but the degree of scheduled event risk was arguably without equal. While election headlines were drawing our attention Thursday, the Federal Reserve and Bank of England announced policy decisions through the active session. Chairman Powell offered up little more than a vow to do whatever was necessary against a backdrop of uncertainty; but the BOE offered up fresh stimulus as the UK enters a new period of lockdown to curb the coronavirus. It doesn’t seem this is a jump that was widespread for the Sterling, so I am not looking at 1.3200 as an porous resistance just yet.
| Change in | Longs | Shorts | OI |
| Daily | 3% | -7% | -3% |
| Weekly | 4% | -10% | -5% |
Chart of GBPUSD with 100-Day Moving Average Overlaid with UK-US 10-Year Yield Spread (Daily)
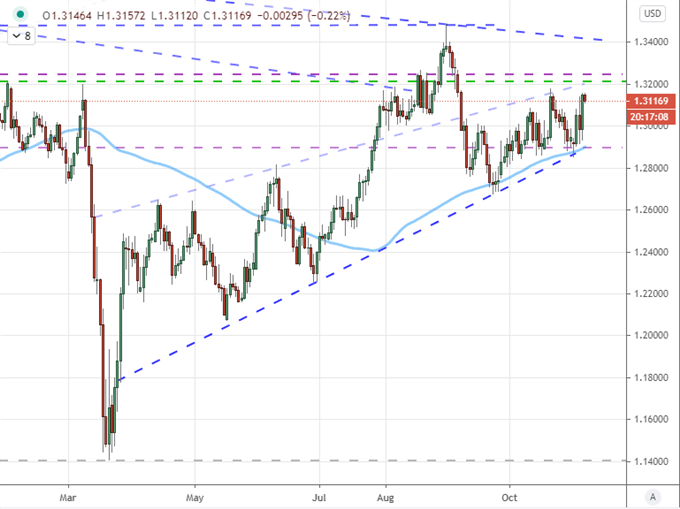
Chart Created on Tradingview Platform
Top event risk into the final trading session of the week – aside from election news – is the scheduled employment data for the month of October. Of course, attention will be fixed on the US nonfarm payrolls (NFPs), but this is going to seriously be competing for our attention (learn more about NFPs and how to trade it). While the state of the US labor market is extremely important as a signpost to economic health and the country’s surpassing 100,000 new Covid cases in a day adds a serious distraction, it will likely take a significantly larger surprise to see this muster control of the markets. In comparison, Canada’s employment statistics are less encumbered by fundamental competition – particularly for pairs like AUDCAD.
Chart of US Total Nonfarm Payrolls and Unemployment Rate (Monthly)
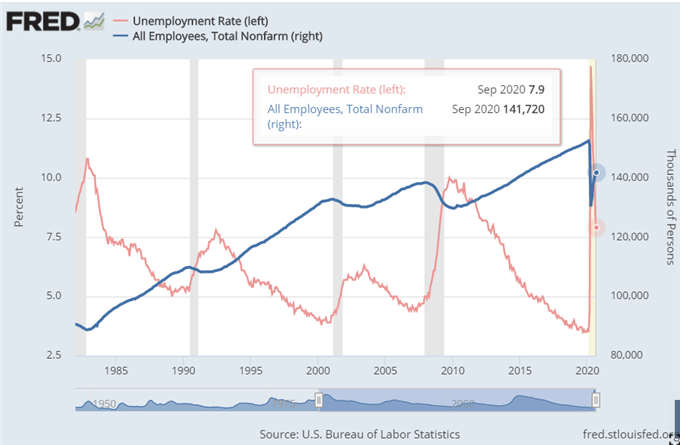
Chart Created on Federal Reserve Economic Database with Data from BLS

.


