


EURUSD, Dollar, S&P 500 Talking Points:
- EURUSD volatility remains elevated while the pair’s range puts greater and greater pressure on a prominent head-and-shoulders pattern
- The S&P 500 closed below its 50-day moving average for the first time in 103 trading days, is this break the cue for a full reversal?
- Top event risk on the calendar will focus on GDP, but the coronavirus and trade wars will pose open-ended systemic risk
Gauging Technical Break Signals Between EURUSD and S&P 500
As we transition into a new week of trading, the expectations for a transition to a clear state of conviction are growing in the investment rank. The speculative bulls point to the ardent resiliency of favorable trends like that seen from the S&P 500 as well as the reassurance of massive stimulus while bears reflect on statistical seasonality and a myriad of fundamental threats circling just on the boarders of the dubious calm. I am looking for a broad correlation of market performance and a clear banner for speculative drive, but others may decide a ‘clean’ technical signal is preferable. But what qualifies as a systemic break that ushers in a wholesale sentiment move? Few chart watchers would likely consider EURUSD’s activity this past week a break. It tested its support – a ‘neckline’ on a head-and-shoulders pattern – but it didn’t clear the barrier. As far as intent goes, this registers very low on the scale of conviction.
| Change in | Longs | Shorts | OI |
| Daily | -1% | -4% | -3% |
| Weekly | 4% | -10% | -5% |
Chart of EURUSD with 50-Day Moving Average, 35-Day ATR and 35-Day Range (Daily)
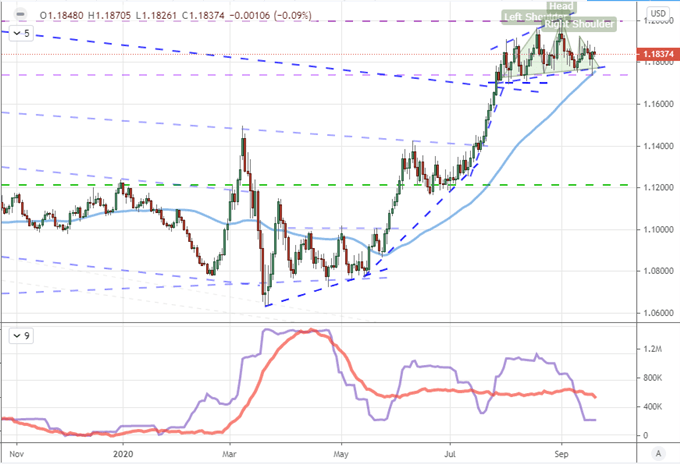
Chart Created on Tradingview Platform
Compare the world’s most liquid exchange rate performance this past week to one of the world’s most representative indices: the S&P 500. The leading speculative measure, closed below its 50-day moving average for the first time in 103 consecutive trading days. That brings a close to the longest statistical climb against this measure in four-and-a-half years. But is that enough to rouse conviction? An H&S pattern also presents here, but the neckline is up for debate. Further, outside this solo asset’s performance, other indices (DAX, FTSE 100, Nikkei 225) and other typical ‘risk’ measures ended the week trading comfortably within their recent ranges.
Read about the head-and-shoulders pattern along with other major technical patterns in our education section.
Chart of S&P 500 with 50-Day Moving Average, Daily Gaps and 7-Day Rate of Change (Daily)
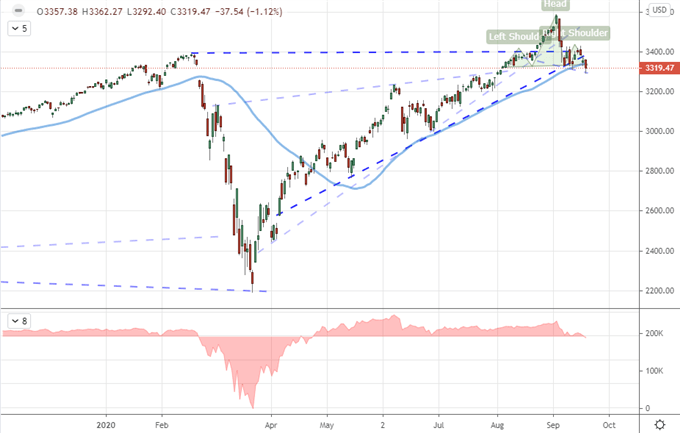
Chart Created on Tradingview Platform
A break from a key benchmark in the risk spectrum typically follows one of two paths. Less often, a technical break from such a measure represents the initial move that other markets are due to follow as the speculative fire spreads. More often, the provocative move fails to gain serious traction as the localized fundamental swell fails to muster the depth that carries a systemic moves. In that scenario, a break can simply peter out or it can draw in the opportunistic ‘dip buyers’. Looking at retail CFD positioning (below from IG), the group has yet to turn net long; but it is as close as we have seen since the brief period it flipped during the height of the pandemic collapse.
| Change in | Longs | Shorts | OI |
| Daily | 1% | -1% | 0% |
| Weekly | 15% | -13% | -1% |
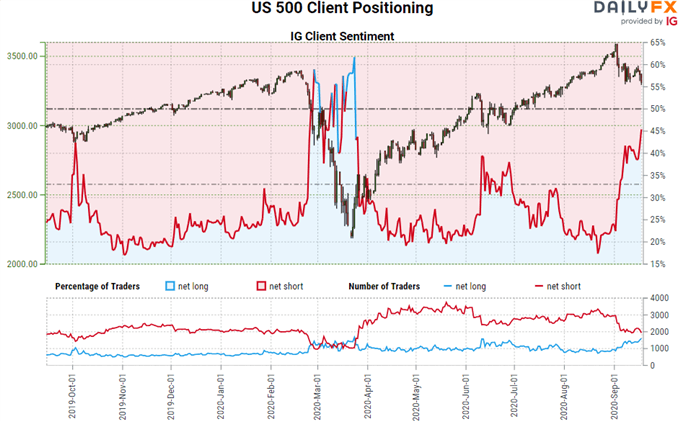
Chart Created by DailyFX with Data from IG
Top Fundamental Themes: Top Volatility Risk
If we filtered out the economic docket for the traditional top listings, it might seem that the monetary policy theme topped out this past week. The Federal Reserve, Bank of England and Bank of Japan policy reflections are behind us without a change to their mixes. That may be true, but I believe this is a more persistent threat to volatility than just a scheduled meeting would imply. There are further rate decisions on tap – like the RBNZ and SNB meetings – but those are unlikely to generate more than isolated heat for the Kiwi Dollar and Swiss Franc respectively. More profound are the scheduled speeches from the heads of the US, Eurozone, UK and Japanese central banks. Further, Fed Chairman Powell is due to testify on policy and Covid support alongside US Treasury Secretary Steve Mnuchin. Ultimately, my interest in monetary policy is keeping tabs on if/when confidence in the collective monetary authority’s ability to keep markets buoyant fails. If it does, there is a considerable gap to other fundamental measures of ‘value’.
Learn more about how central banks impact the FX markets in our education section.
Chart of S&P 500 with Aggregate of Major Central Bank Balance Sheet Holdings (Monthly)
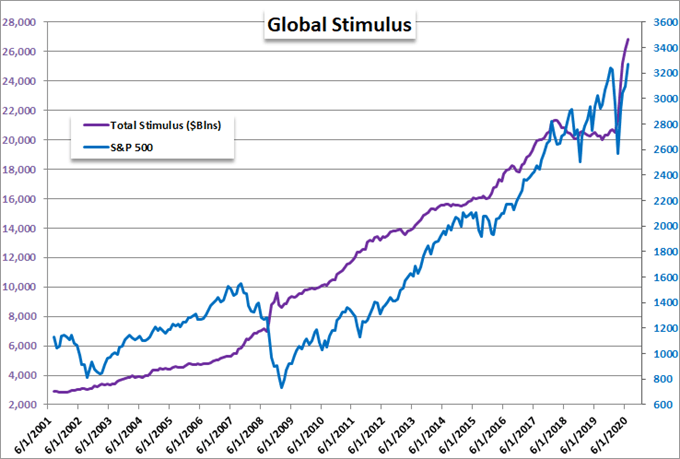
Chart Created by John Kicklighter with Data from Bloomberg Terminal
If we put the emphasis on scheduled event risk, the economic calendar does have a run of data that docket watchers should monitor. On Wednesday, we are due the run of major developed world economies’ September PMIs. These activity readings from Markit are meaningful – and timely – proxies for GDP. With an overview of economic tempo for the US, Eurozone, UK, Japan and Australia; we are due a comprehensive look. Generally, I believe a pickup in activity will struggle to leverage a significant gain in risk assets, but a slide given the backdrop of expectation in a ‘V-shaped’ recovery could catalyze lingering concerns.
Chart of Global PMIs (Monthly)
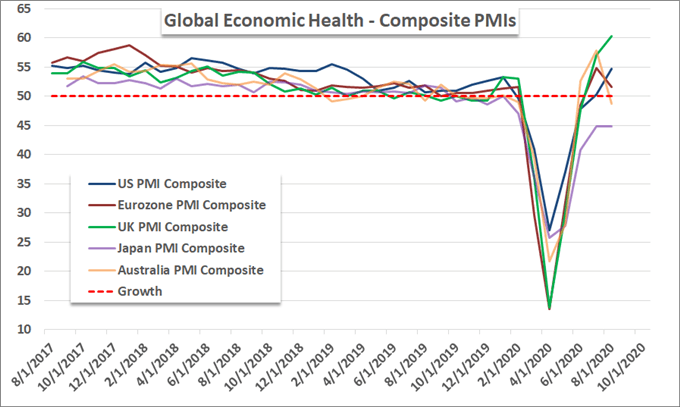
Chart Created by John Kicklighter with Data from Bloomberg Terminal
The Speculative Assumptions
While I will be watching key technical patterns and the attention to high-level fundamental themes like most other traders, my attention will always pull back to the undercurrent of speculative interests and habits. The hallmarks of complacency and the speculative appetite that draws out are still very blatant. Yet, the drive isn’t always one of a FOMO nature. Consider the net speculative futures positioning in EURUSD from the CFTC (Commitment of Traders). While we have pulled back the past few weeks as the pair has stalled below 1.2000, it remains unmistakably extreme.
| Change in | Longs | Shorts | OI |
| Daily | -1% | -4% | -3% |
| Weekly | 4% | -10% | -5% |
Chart of EURUSD with Net Speculative Futures Positioning (Daily)
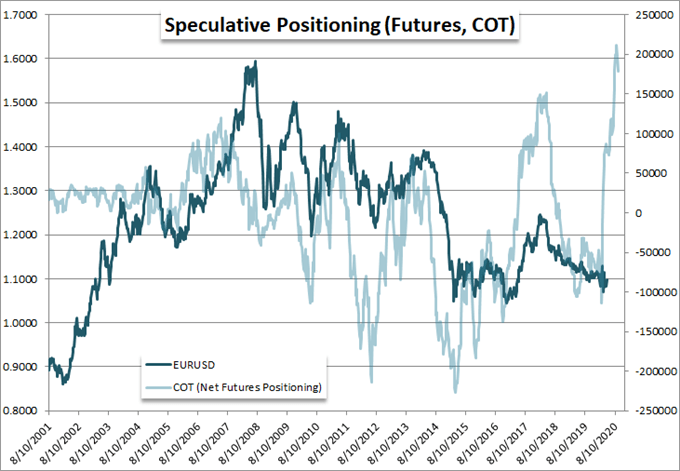
Chart Created by John Kicklighter with Data from Bloomberg Terminal
Looking at the benchmark Dollar itself, this systemic cross roads on so many fundamental dimensions remains under serious pressure. While not as overdrawn as its top pairing (EURUSD), this safe have, principal exchange, currency representation of the world’s largest economy is pushing the extremes set back in February 2018 before trade wars upended the markets. Keep vigilant.
Chart of DXY Dollar Index with Aggerate Dollar Net Speculative Futures Positioning (Daily)
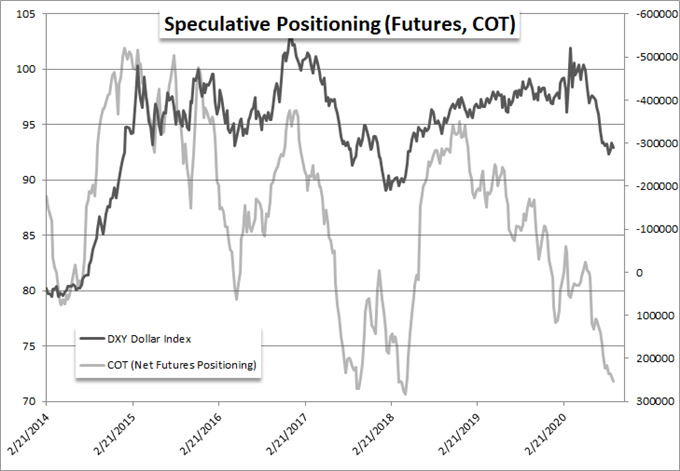
Chart Created by John Kicklighter with Data from Bloomberg Terminal

If you want to download my Manic-Crisis calendar, you can find the updated file here.
.


