


Dollar, EURUSD, S&P 500 Talking Points:
- The Federal Reserve’s decision to trumpet its existing mix of monetary policy Wednesday showed far more impact – of disappointment – on SPX the following day
- Risk benchmarks are seeking a systemic spark as volatility and an unsteady fundamental backdrop threaten to finally tip a trend
- The EURUSD is nearing the end of a head-and-shoulders pattern, AUDUSD’s climb is slowing
The First Gap Down in 7 Days but Support Holds
The FOMC (Federal Open Market Committee) rate decision Wednesday afternoon resulted in a remarkably restrained move from US indices and other risk benchmarks. Yet, the implications of the world’s largest central bank reinforcing the cap on its steadily escalating support would exert another wave of risk aversion through this past session. It is important to remember that the US indices are just off of record highs despite the reality that we are still traversing the most intense recession since the Great Depression. With that kind of backdrop, it would come as little surprise that a steady feed of external motivation would be necessary to keep sentiment afloat – much less trending even higher. With that in mind, the S&P 500 put in for its first gap lower in 7 consecutive trading days. Despite the swoon, the 50-day moving average and range floor at 3,300 managed to hold. A break through the near-term is likely, but follow through likely depends on what systemic driver takes responsibility for the move.
| Change in | Longs | Shorts | OI |
| Daily | 1% | -1% | 0% |
| Weekly | 15% | -13% | -1% |
Chart of S&P 500 with 50-Day Moving Average, Daily Gaps and 7-Day Rate of Change (Daily)
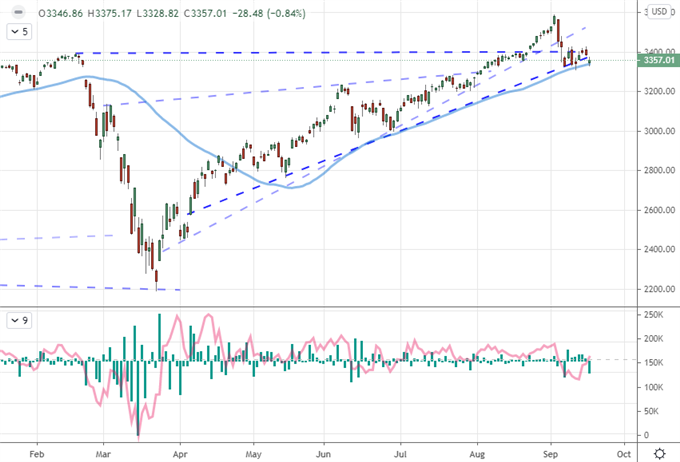
Chart Created on Tradingview Platform
Looking across the spectrum of ‘risk assets’ I like to refer to when assessing market conviction, there was a similar lack of commitment with a host of gaps and general restriction to range. When I look for the development of trends across the financial system, a preferred measure is high correlation across liquid, leading speculative measures (SPX, DAX, EEM, USDJPY, etc) with a meaningful tempo. Correlation is still in place and volatility is boiling beneath the surface, but traction remains agonizingly absent. It is worth considering the concept of sentiment urging markets rather than defaulting to the guidance of a single asset. The Nasdaq 100 for example slipped its 50-day moving average with Thursday’s gap; but its correlation to other US indices suggests this is a false break anchored to the S&P 500’s indecision or the leading move for other assets to follow. What is more probable?
Chart of Nasdaq 100 with 50-Day Moving Average, NDX-SPX Ratio and Spot-50DMA Disparity (Daily)
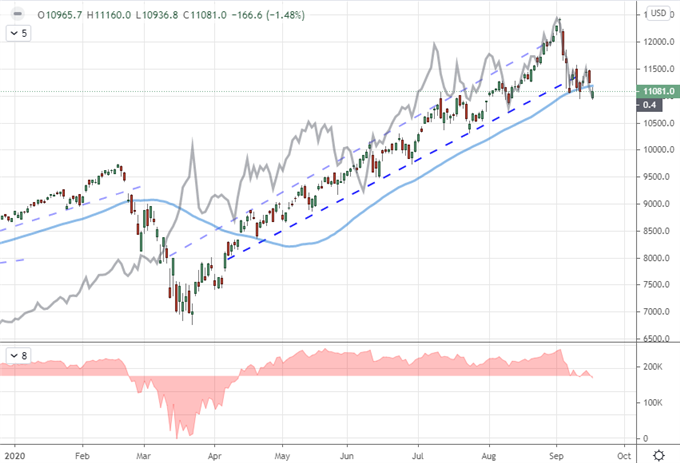
Chart Created on Tradingview Platform
Trends Develop Where Liquidity Meets Systemic Motivation
As we look forward to the final trading day of this week, the probabilities of jump-starting a serious trend will ebb. With eight days of range and clear technical boundaries, the fading hours of liquidity before the weekend will progressively cut into the necessary depth to spur a technical break to something more substantial. Nevertheless, it is worth recalling the seasonality picture on the higher scale. September is still a critical month for volatility while volume starts to rise later in the month – resulting in the only average loss in a month for the S&P 500 in a calendar year (according to data going back to 1980).
Table from Federal Reserve’s Summary of Economic Projections from September 2020 Meeting
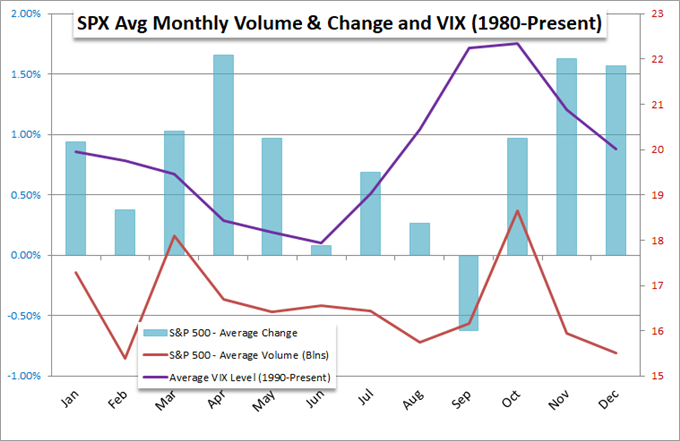
Table from Federal Reserve
For headlines, monetary policy extended its fundamental attention grab this past session. On the heels of the Fed’s policy hold, the Bank of Japan (BOJ), Bank of England (BOE) and South African Reserve Bank (SARB) all left their rates and stimulus efforts unchanged. Of these groups, the UK authority’s reached further into the global scale. According to the MPC, the world’s sixth largest economy is at risk of seeing its recovery stall if the pandemic continues its resurgence. That seems a principal consideration for their investigating the viability of negative rates. Though, all things considered, I place greater weight on ongoing trade negotiations when it comes to near-term GBPUSD volatility risk.
Learn more about how central banks impact the FX markets in our education section.
Chart of S&P 500 with Aggregate of Major Central Bank Balance Sheet Holdings (Monthly)
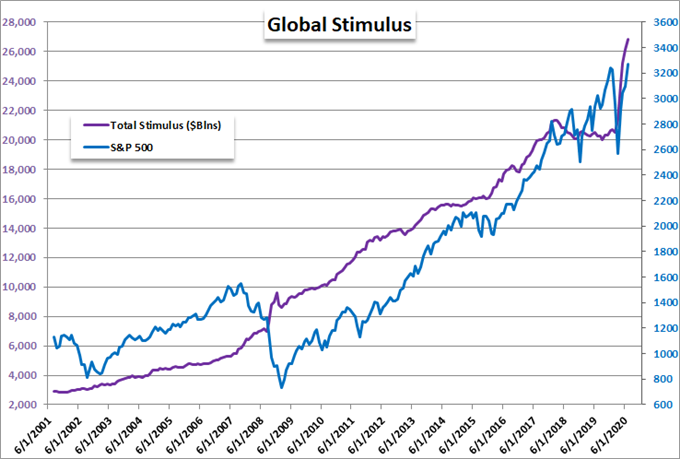
Chart Created by John Kicklighter with Data from Bloomberg Terminal
Ultimately, monetary policy is one of the most pressing systemic concerns on my radar for much grander and long-term reasons. Though some may not appreciate it, the market’s stability and even its speculative reach these past years has drawn heavily upon the external support the world’s largest central banks have built into the financial system. Many have feared what happens when the major players start to withdrawal that expansive support – and indeed we saw it happen starting in 2015. Yet, my concern is what happens should confidence in stimulus falter even if it is expanding in response to economic and/or financial trouble?
Chart of Monetary Policy Effectiveness
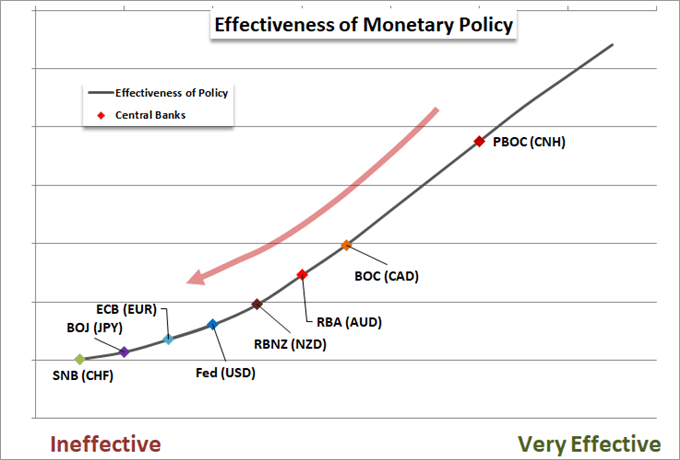
Chart Created by John Kicklighter
Key Pairs to Watch Friday and Beyond
At the top of my list of pairs to watch moving forward is the EURUSD. This benchmark’s role as the world’s most liquid cross certainly contributes to its appeal as it tends to reflect more systemic trends. That said, from what driver will it take its lead? Below, the pair is overlaid with the S&P 500 – a risk benchmark. The more recent head-and-shoulders pattern paints a provocative picture. Yet, the Dollar’s safe haven status can readily be called into question. Consider also the competitive outlook for recovery which has recently been shaken by the OECD’s forecasts while the WHO recently warned that Europe’s weekly COVID cases have surpassed the March peak. Monetary policy, trade wars and geopolitical issues are further active matters that are competing for control.
| Change in | Longs | Shorts | OI |
| Daily | -1% | -4% | -3% |
| Weekly | 4% | -10% | -5% |
Chart of EURUSD with 50-Day Moving Average Overlaid with SPX and Wicks Below (Daily)
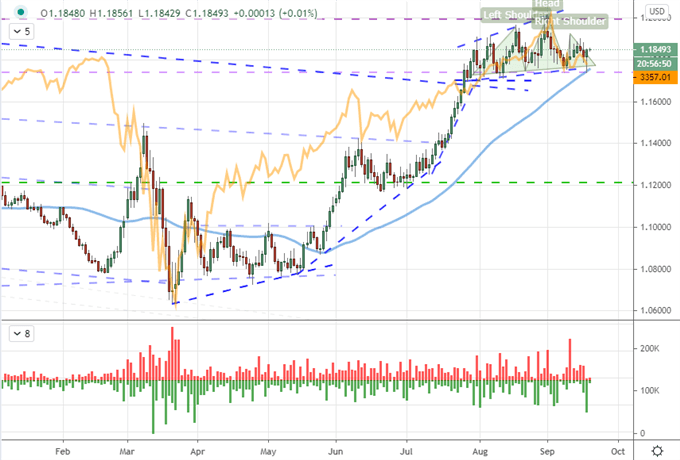
Chart Created on Tradingview Platform
Another pair with overlapping layers of fundamental intrigue to raise the risk in its technical picture is AUDUSD. The cross is more historically connected to risk trends, it has defied the crumbling backdrop for Australia’s economic dependency on China and data continues to print for both sides. Many may have their interest piqued by a 0.7400 or 0.7200 break, but I would be more impressed if this pair were to realign to one of the aforementioned major themes.
Chart of AUDUSD and 50-Day Moving Average (Daily)
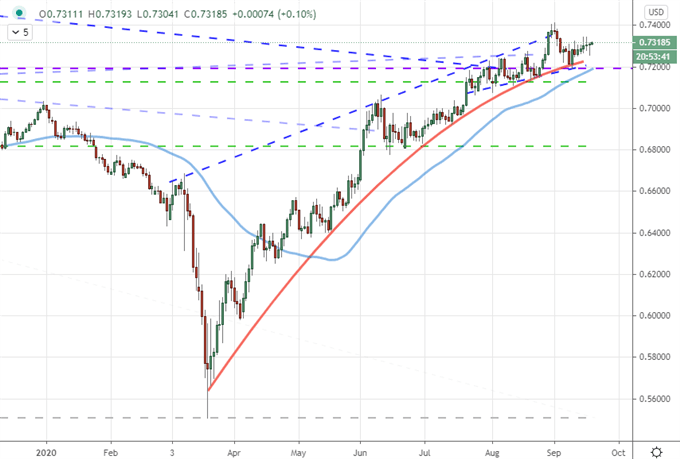
Chart Created on Tradingview Platform

If you want to download my Manic-Crisis calendar, you can find the updated file here.
.


